- Introduction to Sustainability Economics
- Economic Growth, Sustainability, Market Failures
- Quantifying the Economic Value of the Environment, Part 1
- Quantifying the Economic Value of the Environment, Part 2
- Market Value of Firms’ Sustainability Investments
- Costs of Sustainability Investments: Basics
- Firm’s Capital Costs and Environmental Risks
- Welfare Economics
- Principles of Benefit-Cost Analysis (BCA)
- Extensions of BCA: Distribution, Substitutability, and Uncertainty
- Environmental Policy: Instrument Choice and Efficiency
- Policy: Distribution and International Cooperation
- Collapse, Resilience, and Common Pool Resources
- Measuring Sustainable Development
1. Introduction
Economics is the study of how people use scarse resources and respond to incentives.
Sustanability economics tries to understand and manage the long-term relationships between humans and nature so that scare enviromental goods, and their human-made substitues or complements, are being used efficiently.
Sustainability approaches tries to understand what do we want to preserve:
- Income, consumption
- Wealth, capital
- Utility, social Welfare
- Possibilities, opportunities
- Nature, ecosystem
- ...
An Outcome-Oriented approach seek to preserve realized human well-being over time (actual experience).
An Opportunity-Oriented approach seek to preserve means to generate welfare (potential of the future).
In relation to this, we define Capital as stock that can be used to deliver a flow of services, and we distinguish:
- : human capital (people, education, health)
- : physical capital (infrastructure, machines, buildings)
- : natural capital (ecosystem, atmosphere)
Comprehensive Wealth incluse the total value of all capital stocks.
- "Weak" sustainability use and invest in natural and human-made capital stock such that comprehensive wealth doesn't decline:
- "Strong" sustainability use and invest in natural and human-made capital stock such that no stock falls below a critical level:
Example: a strong approach to climate change limits temperature change below critical levels (example: limit warming at 2° no matter of the cost).
A weak approach balances costs and benefits of emissions reductions (impose carbon tax to ensure that fossil fuels are only burned when their benefit exceed social cost).
2.1 Economic Growth, Sustainability, Market Failures - Macroeconomic Refresher
GDP (Gross Domestic Product) is the market value of the final goods and services produced within the borders of a country during a particular time period.
It can be measured in 3 ways:
- the production approach
- the expenditure approach
- the income approach
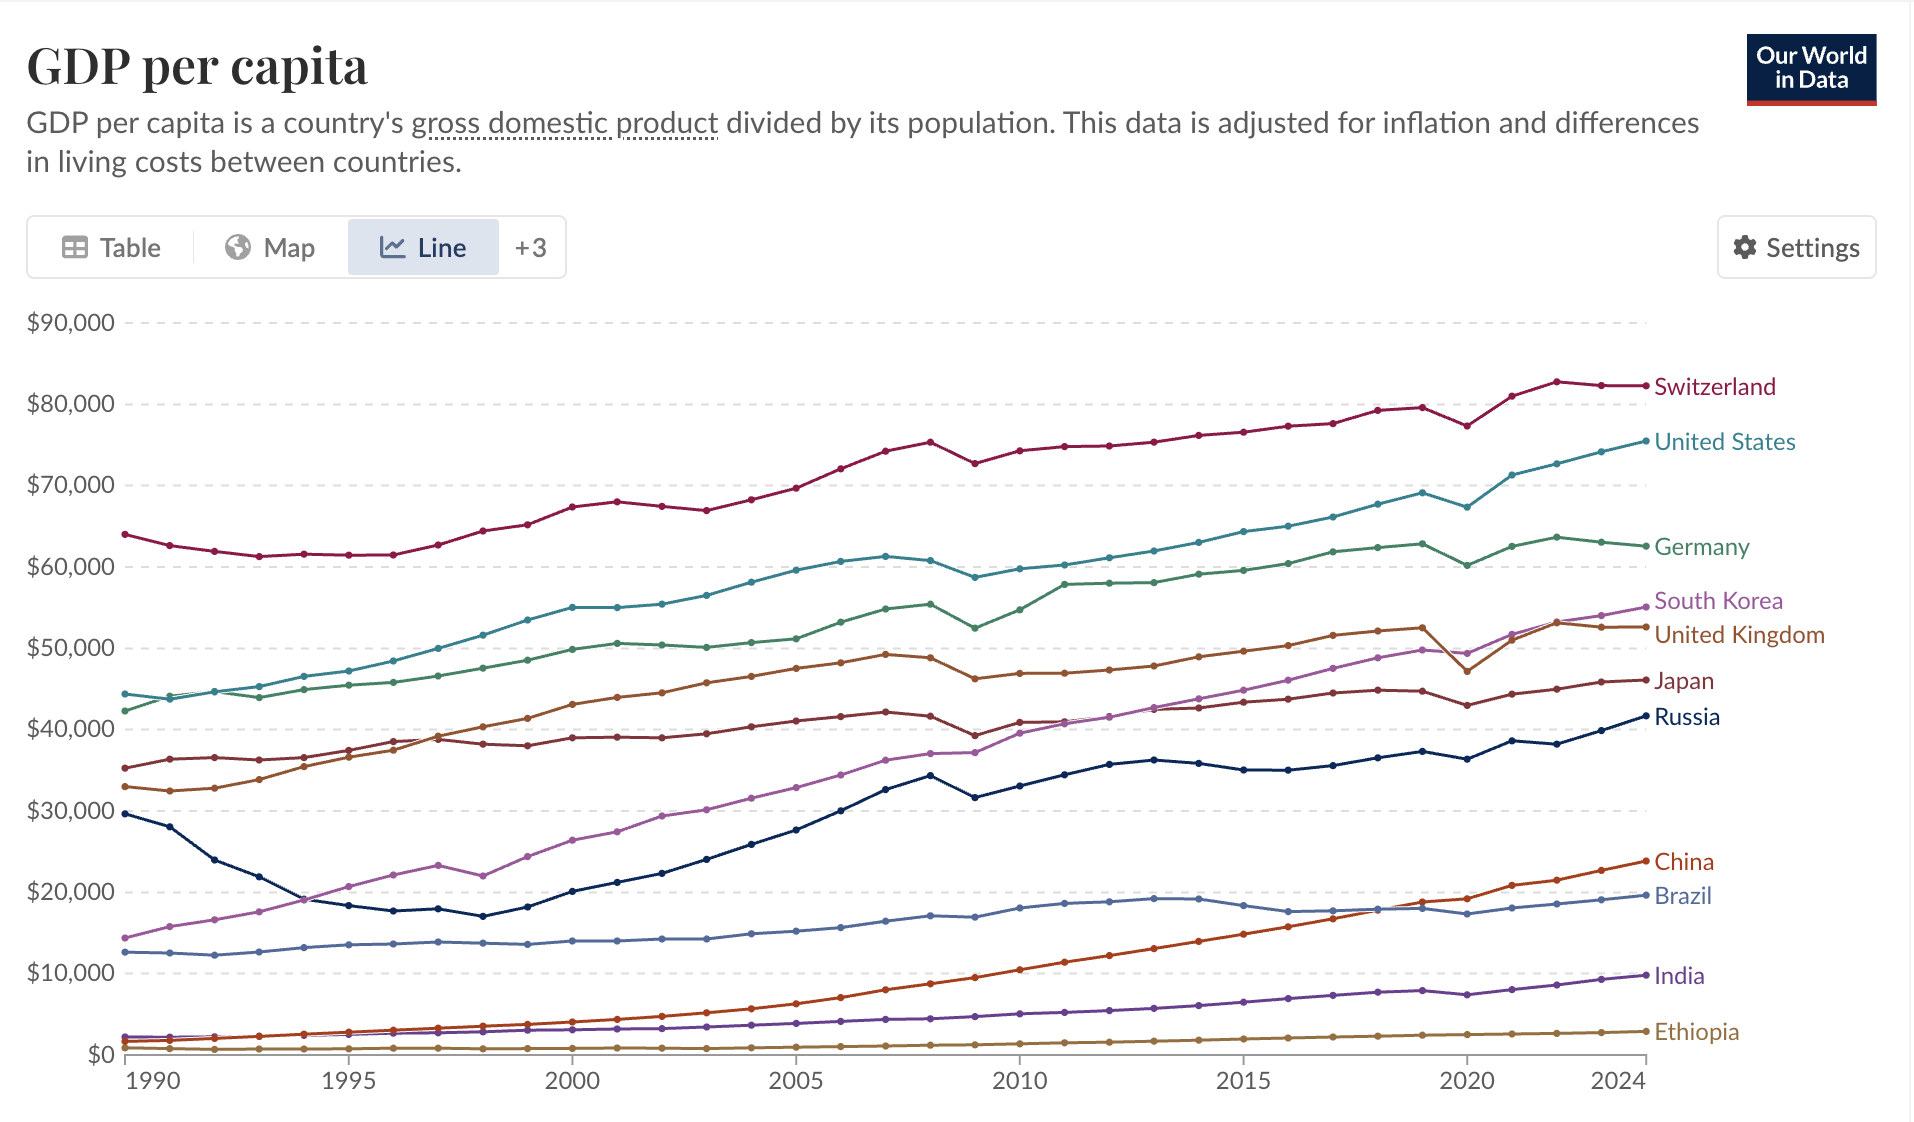
GDP Stats by Country [Our World in Data]
The idea behind the production approach is to sum up the market value of the final goods and services produced in a year.
Example: Giacomo's Racing Bikes
Giacomo's Land is a small country with one employer (Giacomo's GmbH) that produces 100 racing bikes a year. The market price of an racing bike is (yes, they are very expensive!).
All Giacomo's Land citizens work in the bike factory, that also owns all the machines, so it onlz needs to hire workers.
To determine the market value of production, we simply do:
Note that we focus to the final value at tend of the production chain (value added), so we sum the ssales revenues minus the firm's purchases of intermediate products to avoid double-counting.
The expenditure approach looks at the total value of expenditures on goods and services produced in the domestic economy by considering:
- : consumption (good and servies bought by domestic households)
- : new physical capital investments from domestic households and domestic firms
- : government expenditures
- : exports of goods and servies produced domestically and sold abroach
- : imports of goods and services produced abroad and sold domestically
and calculating GDP () as:
Nominal GDP is the total value of production using current market prices to determine the value of each unit.
- An increase in GDP will record both increases in actual production and increases in the prices of goods and services.
Real GDP is the total value of production using constant market prices_.
Real GDP allows then to compute real changes in output across time since we adjust for the price levels.
In a similar way, PPP (Purchasing Power Parity) adusted income measures adjust for differences in cost of living across locations:
A very useful tool to visualize PPP adjustments is Numbeo - Cost of Living .
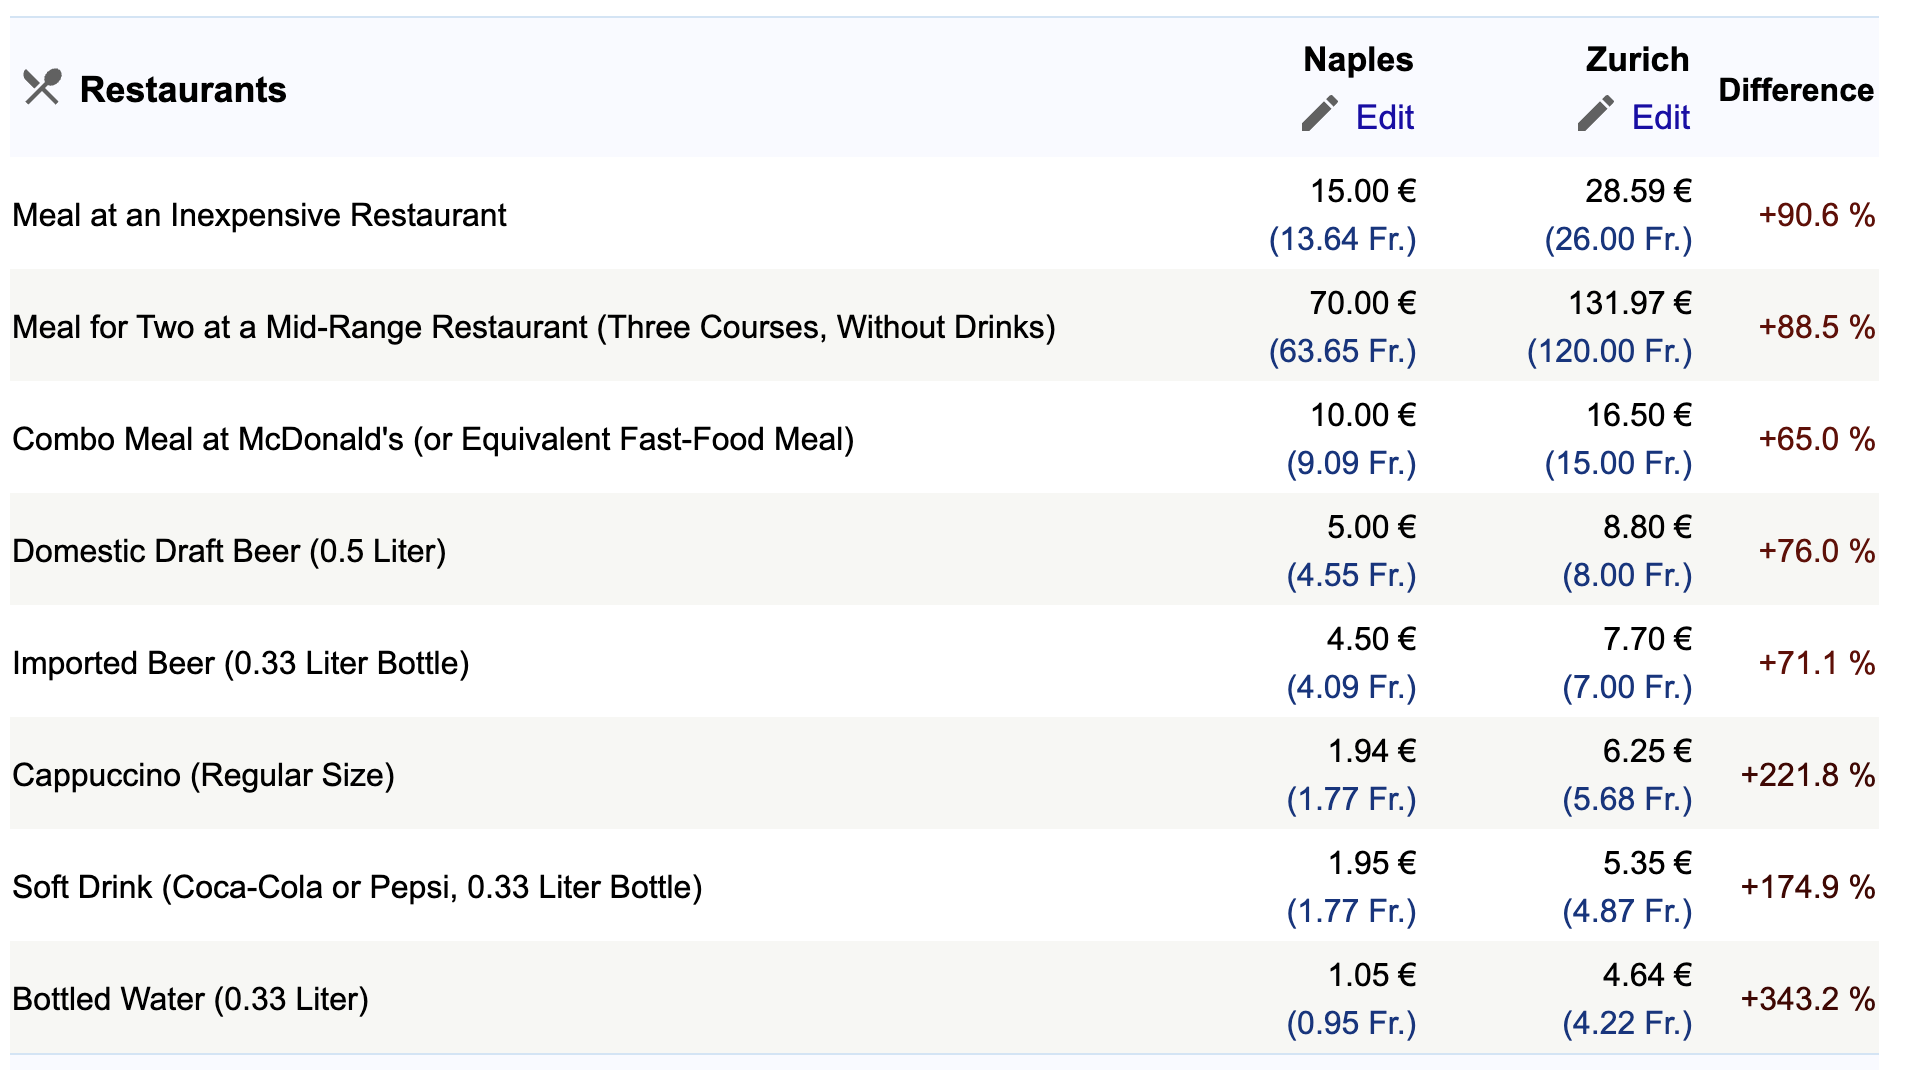
For example, this comparison between Zurich and Naples shows absolute different in prices. If we want to compute PPP Adjustments, we simply do:
For example, in case we wanto to compare salaries, and we assume the following:
- average pizza-man salary in Naples: €
- average pizza-man salary in Zurich: € we just have to re-compute the Zurich'one with the PPT adjustments:
meaning that purhcasing power of Zurich's pizza-men is actually higher.
We recall that the aggregate production function for GDP is:
- : investment and construction
- : labor force participation
- : education
- : improvements in technology, institutions, management etc...
However, in the long run, the only source of sustained GDP per capita growth is the growth in productivity . (Note that, given the right incentives, market can direct productivity improvements in almost any direction).
Starting from the aggregate production function, the Integraded Assessment Modelds (IAMs) integrade enviromental and resource dynamics into macro-economic analysis.
Firstly, we can account for the role of (fossil) energy $E£ in the GDP production:
Intuition: using more (and cheap) energy today increases GDP today.
Then, we add climate model to account for effects of fossil use energy on warking :
and then we add to the GDP's formula:
Note that, in reality, energy consumption affects all the determinants of GDP, not only the productivity (for example, investments depends on depreciation rate, also affected by climate change). Most important, climate changes also has strong effects that don't affect GDP directly (non-market impacts such as elderly mortality, biodiversity etc etc...)
2.2 Economic Growth, Sustainability, Market Failures - Microeconomic Refresher
For a better review, please also refer to my microeconomic notes .
First Fundamental Theorem of Welfare Economics states that, in absence of market failures, free competitive markets lead to the economically efficient outcome.
- Intuition on the consumer side: consumers spend money on a given good until their marginal benefit from another slice is just equal to the marginal cost (the price they pay) of buying an additional unit.
- Intuition on the producer side: firms produce as much of a good until their marginal cost is just equal to the marginal revenue they sell at.
Markets allocate scarse resources efficiently because prices serve as a signal of the value and cost of using the resorces to produce a given good.
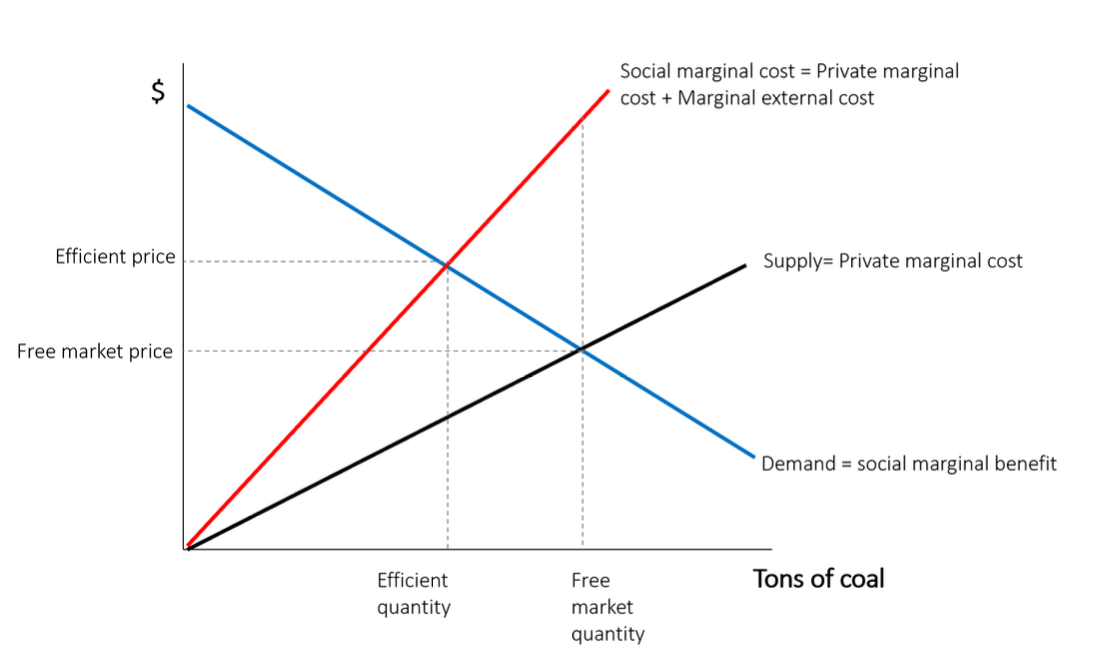
A market failure is a problem that causes the free market to deliver an outcome that is inefficient.
- Private marginal cost is the direct cost of producers of producing an additional unit.
- Social marginal cost is the private marginal cost plus any external costs or benefits of producing an additional unit.
Intuition: social marginal costs measure the full costs to society.
2.3 Economic Growth, Sustainability, Market Failures - Integrade Assessment Models (IAMs) and the DICE Model
IAMs are integrade models of the economy and the enviroment.
In macroeconomic, there are the following assumptions and behaviors:
- firms maximize profits
- households maximise well-being
- agents anticipate the future
- market equilibrium represents a solution.
Interdisciplary and policy IAMs often take these assumptions are given, but they miss the feedback loop: they calculate how growth affects the climate, but they struggle to calculate how much that climate change affects back into the economy.
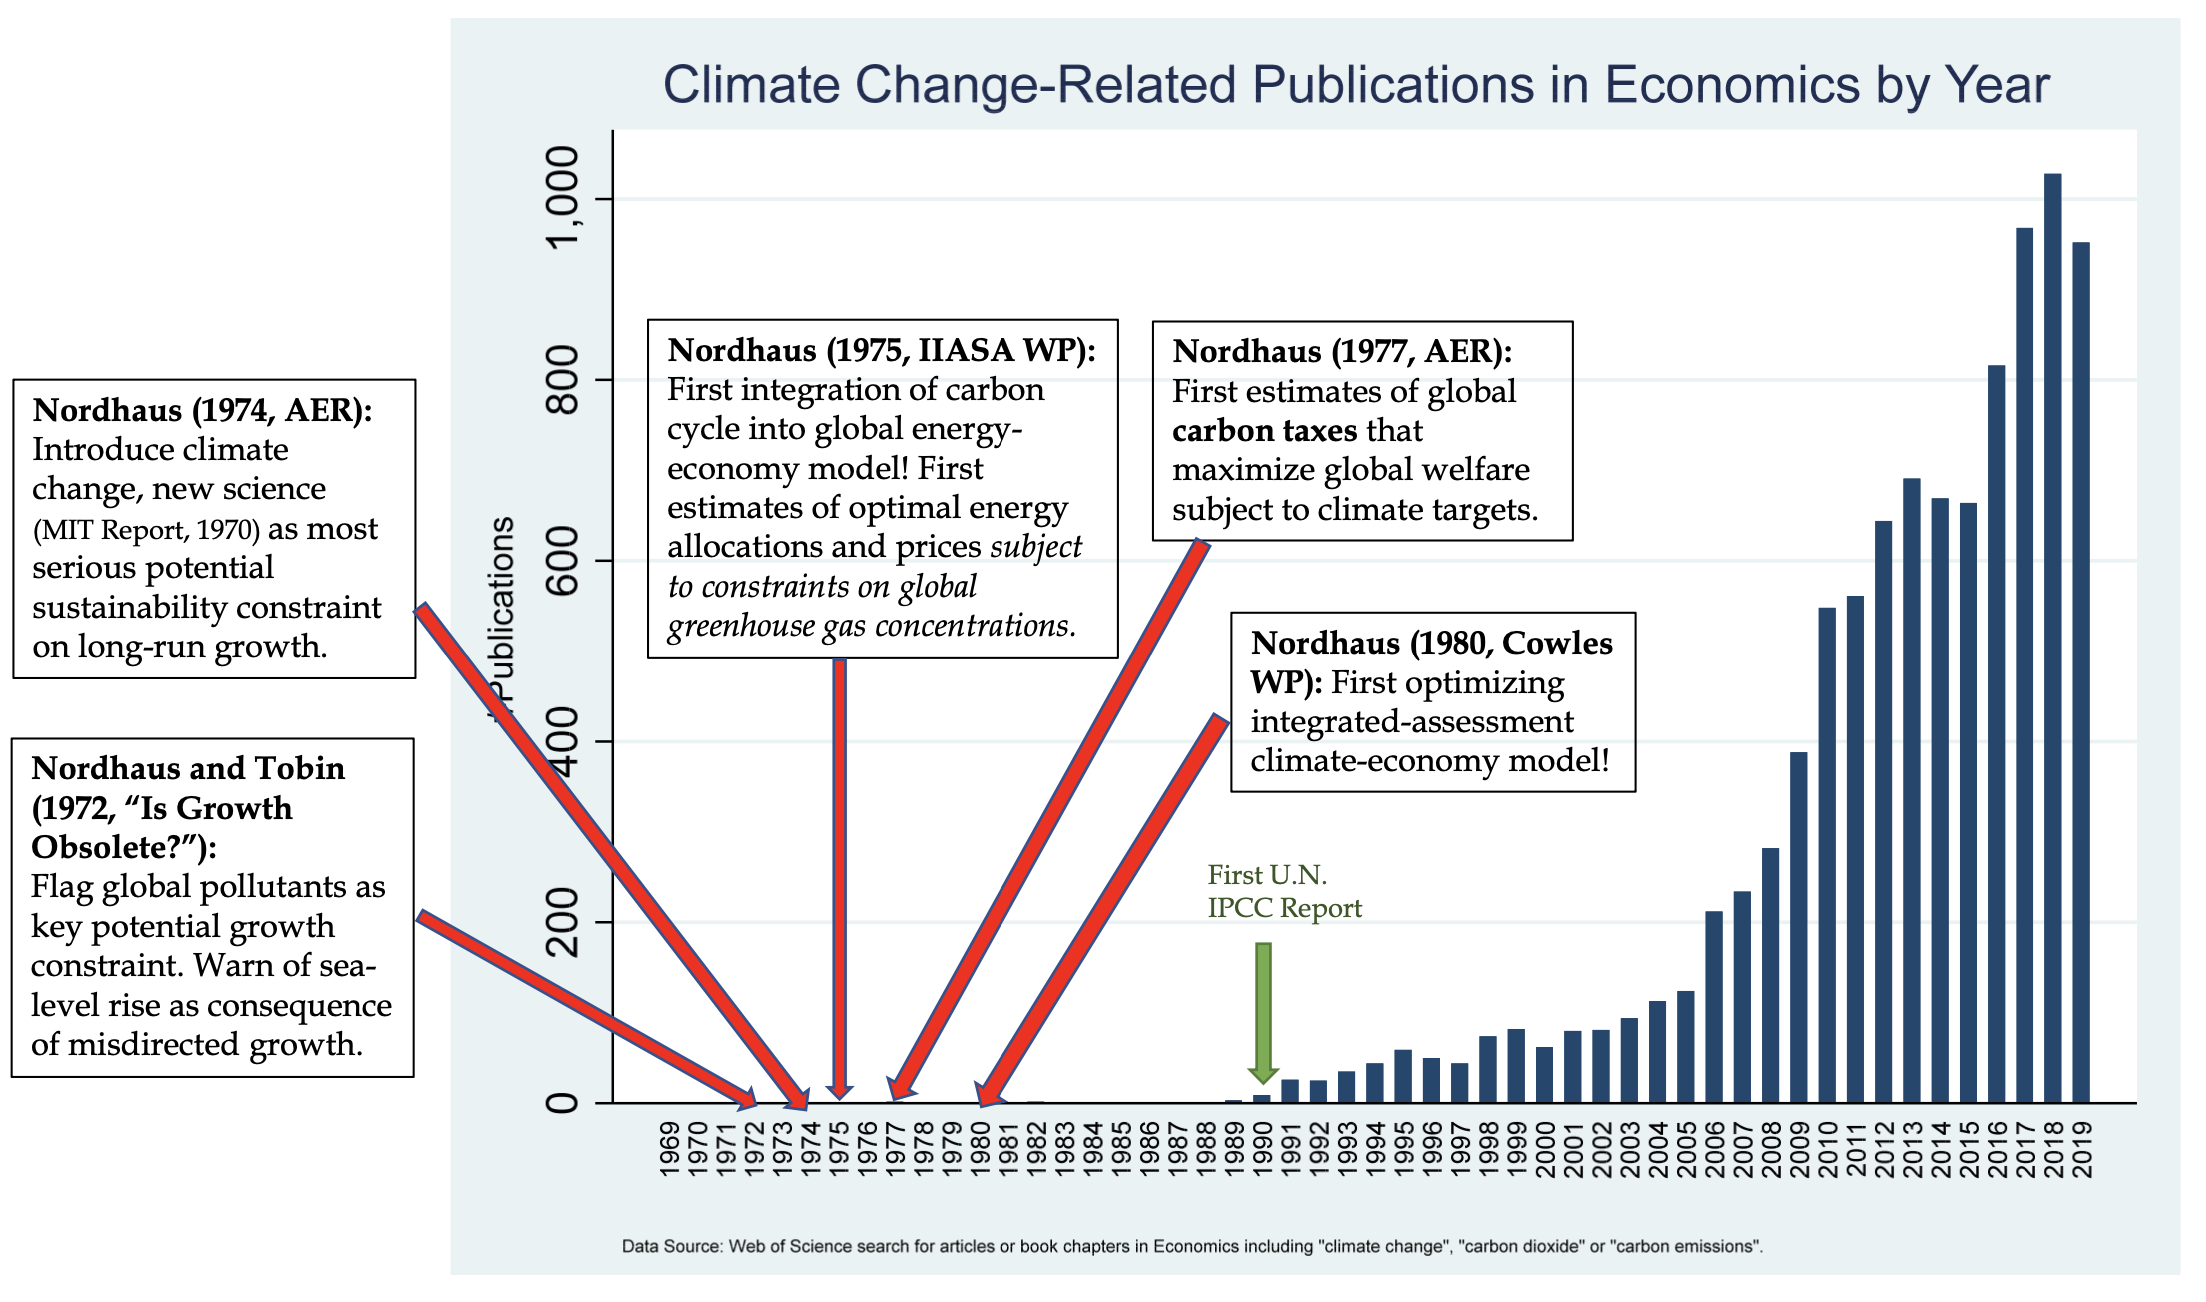
The Nordhaus DICE Model (1992) is based on the Ramsey-Cass-Koopmans growth model, whose aggregate production function is:
where is the global gross output, the total factor productivity, the capital stock and the labor. (Note that many IAms also include energy services as production input).
The DICE models also introduce calculates the baseline industrial carbon emissions as:
where is the baseline emissions intensity of the economy. (Note that, in the past showed a linear-decading trend).
In addition to this baseline decarbonization trend, society can undertake additional efforts to reduce carbon emissions so, if we define as the fraction of emissions reduced, we can model:
and then we represent the costs of emissions reductions as a share of GDP:
The Nordhaus DICE Model also accounts for CO2 emissions and, from the atmospheric carbon concentrations , it models the increased radiative forcing (measuring how much extra heat (in Watts per square meter) is being trapped at any given time .)
-
: This ratio compares the current amount of carbon in the atmosphere () to the levels before the Industrial Revolution ().
-
The Logarithm represents the diminishing returns of . Every time you double the concentration, you get a fixed increase in temperature.
-
(Eta) is the climate sensitivity parameter
-
& : These represent forcings from sources other than (like Methane or Aerosols).
Intuition: increasing increased temperatures.
The model indeed estimated the global atmospheric surface temperature change over pre-industrial levels, as a function of the history of CO2 emissions and other forcings:
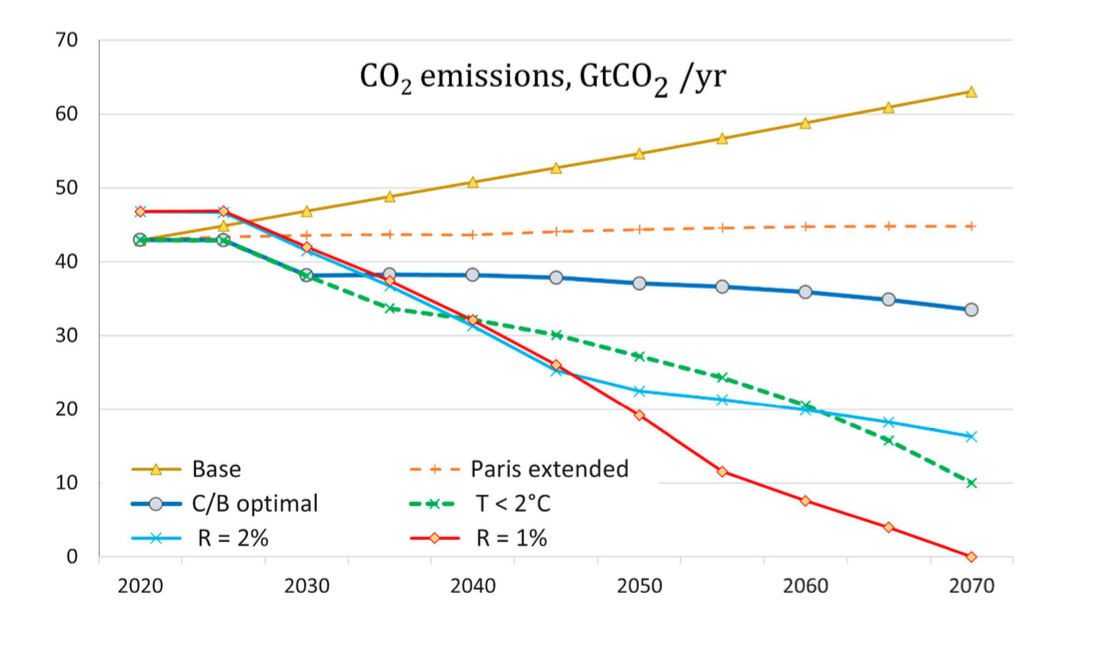
Furthermore, regarding the DICE model, we can consider 5 different scenarios:
- Baseline: Current policies + trends
- Global carbon price of $6/tCO2 in2020, growing 2.5% per year
- Paris Extended:Reach 2030 goals + continue
- Emissions control rate growing ≈0.5p.p./yr from2030-2100
- Cost-Benefit Optimal: Maximize welfare function
- 2◦Target: Maximize welfare + temperatur econstraint
- Alt. Discounting: Modify utility parameters to yield (near) constant discount rates of 1%, 2%, ... 5% per year
3. Quantifying the Economic Value of the Environment, Part 1
Methods to value the enviroment include:
- statistical methods
- experiments
- structural models
- structured surveys
| Source | SCC estimate (USD/tCO2) |
|---|---|
| Nordhaus (2018) | 36 |
| Barrage and Nordhaus (2024) | 50 |
| United States, EPA (pre-Trump) | 190 |
| Haensel et al. (2020) | 210 |
| Switzerland, Infras for BAFU (2024) | 500 |
| Germany, EPA (2024) | 330 or 880 |
Differences are largely driven by:
- (a) assumptions on discounting
- (b) damage estimates
- (c) model structures
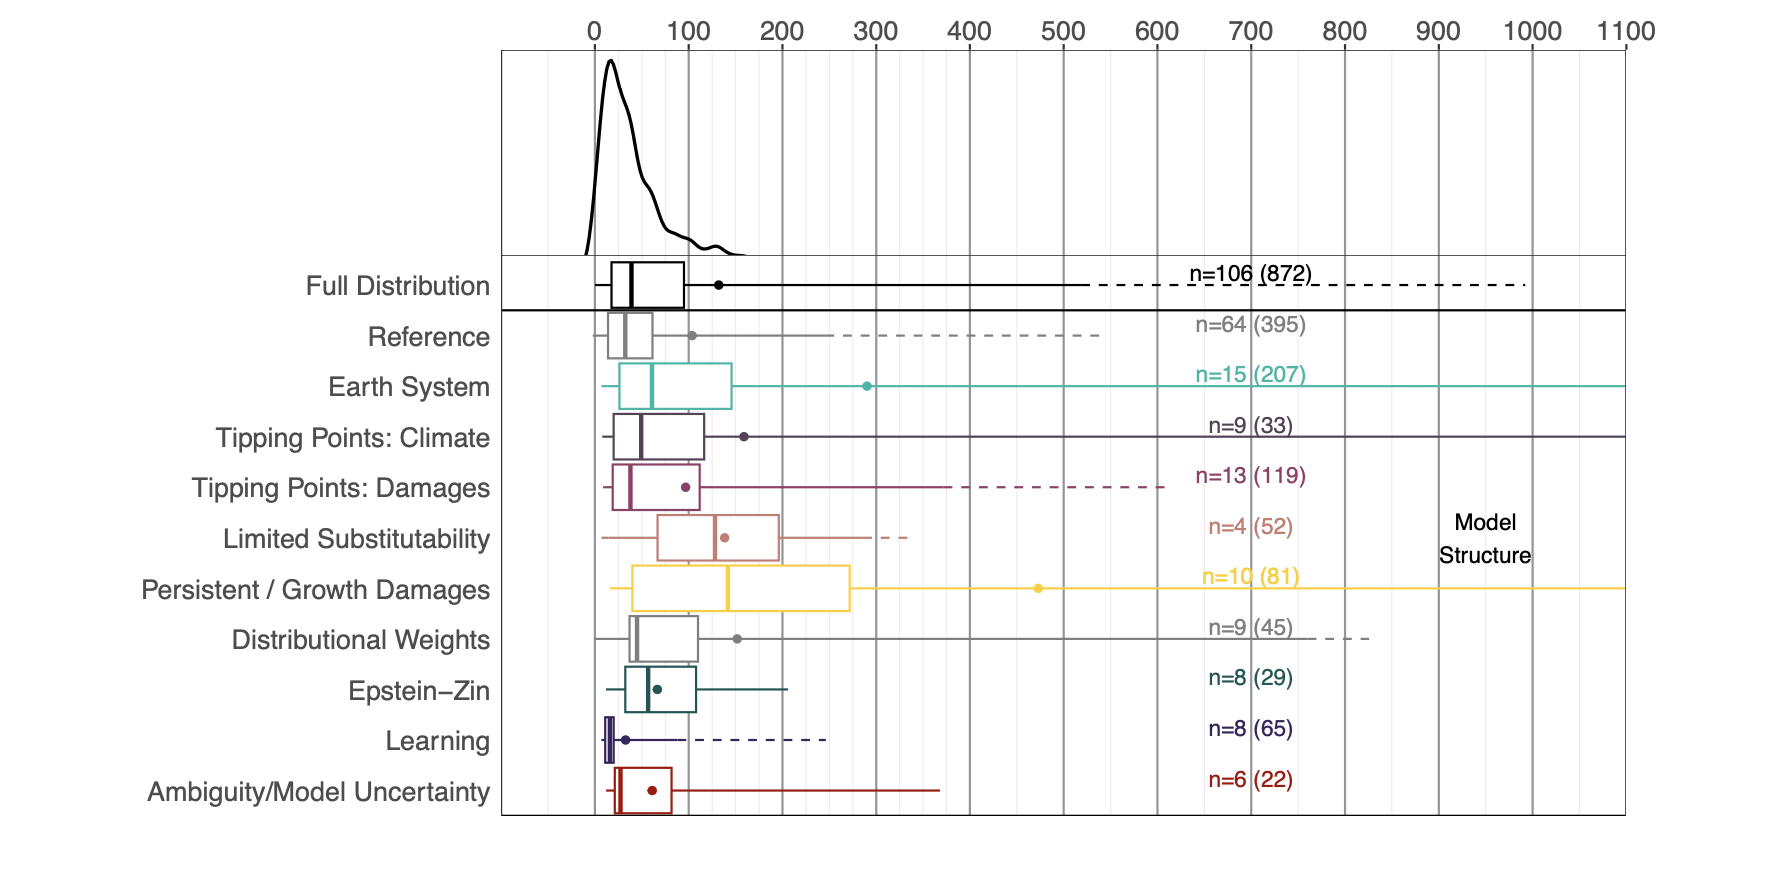
- Systematic analysis of SCC values and their structural drivers published between 2000 and 2020, using 1823 estimates from 147 studies.
- Complementary expert survey of SCC authors (N = 66/176), eliciting views on:
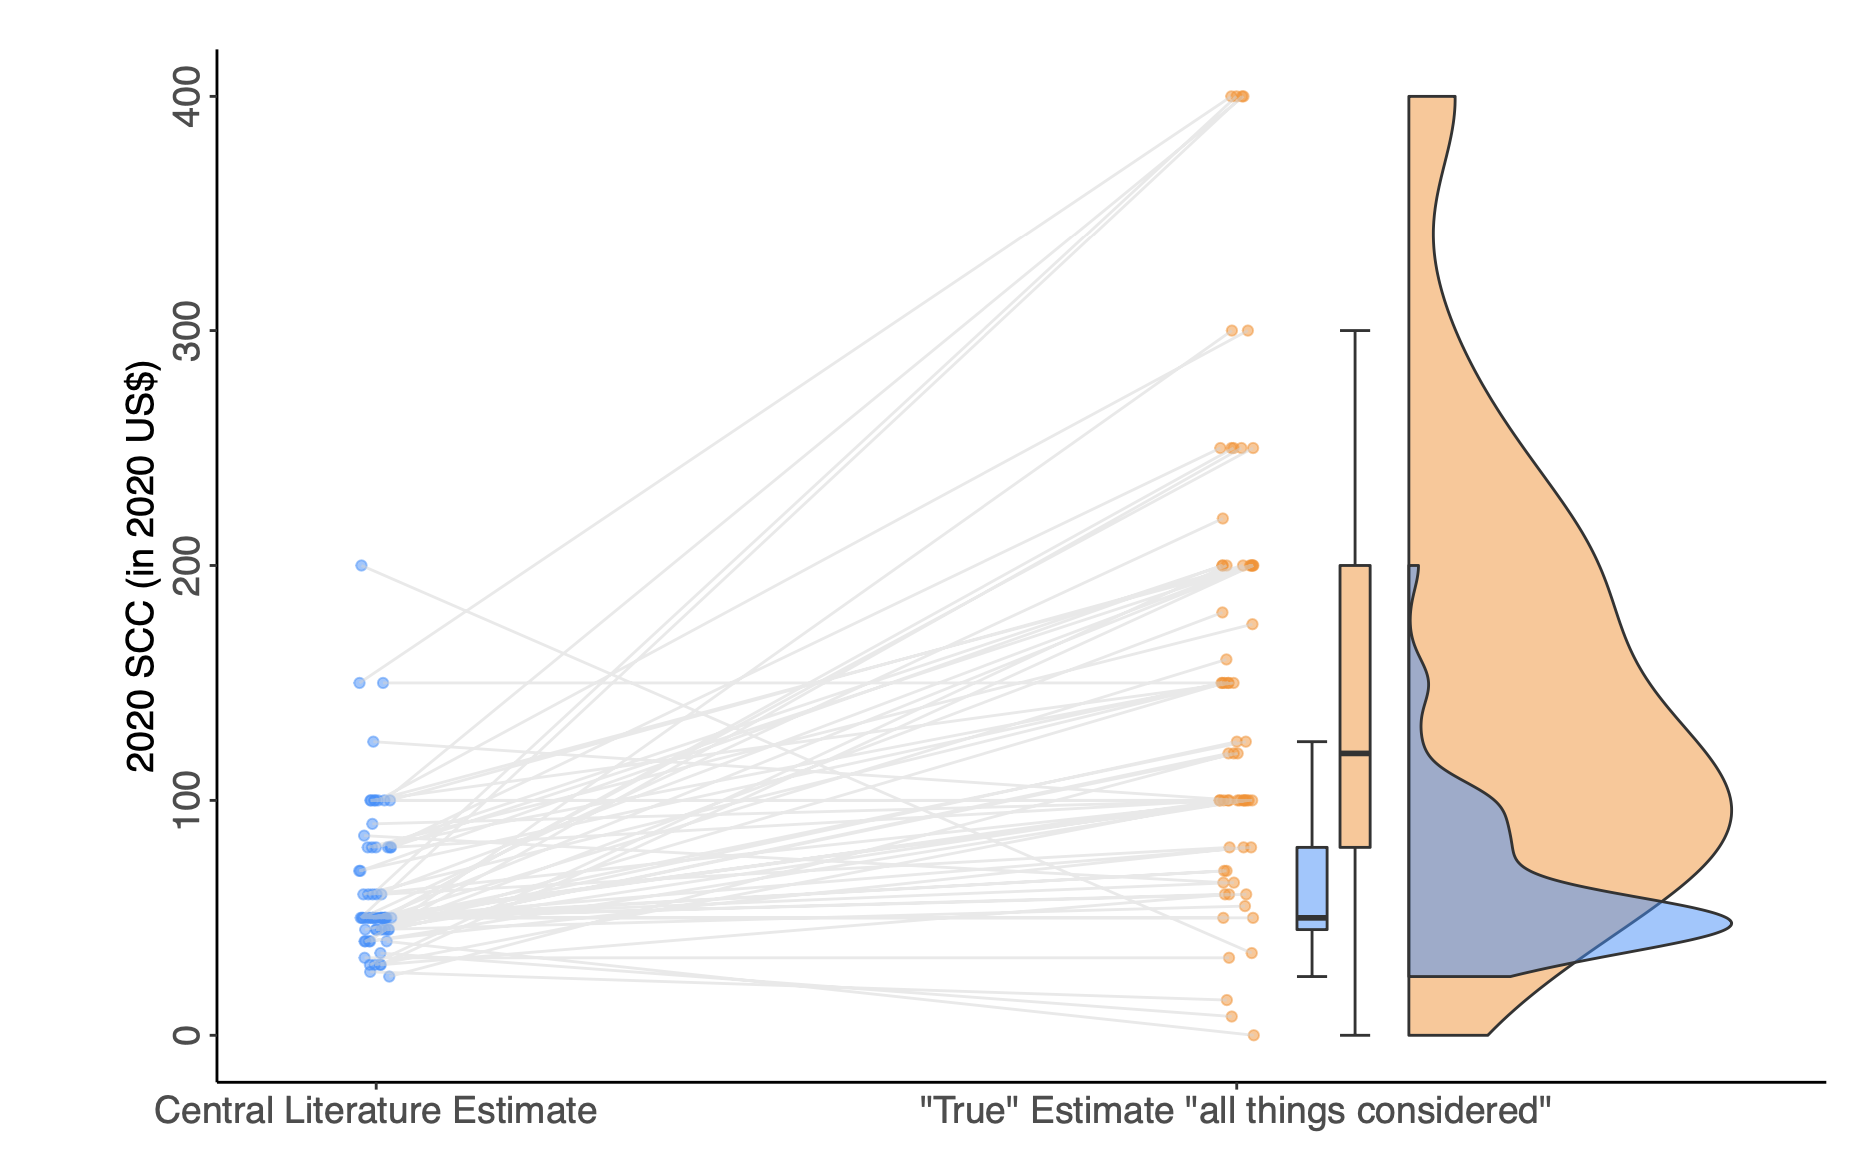
- the distribution of published SCC values ("literature SCC")
- the distribution of "true" SCC values ("all things considered")
- perceived drivers of the gap between these two distributions ("SCC wedge")
- Re-weighting of literature estimates using expert assessments of structural model choices and discount rates to generate new "synthetic SCC" estimates.
We identified 1823 SCC estimates from 147 papers, following this distribution:
| Source | SCC estimate (USD/tCO2) |
|---|---|
| Nordhaus (2018) | 36 |
| Barrage and Nordhaus (2024) | 50 |
| United States, EPA (pre-Trump) | 190 |
| Haensel et al. (2020) | 210 |
| Switzerland, Infras for BAFU (2024) | 500 |
| Germany, EPA (2024) | 330 or 880 |
Differences are largely driven by:
- (a) assumptions on discounting
- (b) damage estimates
- (c) model structures
- Systematic analysis of SCC values and their structural drivers published between 2000 and 2020, using 1823 estimates from 147 studies.
- Complementary expert survey of SCC authors (N = 66/176), eliciting views on:
- the distribution of published SCC values ("literature SCC")
- the distribution of "true" SCC values ("all things considered")
- perceived drivers of the gap between these two distributions ("SCC wedge")
- Re-weighting of literature estimates using expert assessments of structural model choices and discount rates to generate new "synthetic SCC" estimates.
VLS represents the value of the mortality risk reduction.
Examples: how much are you willing to pay to travel in airplan with higher safety standards? How much are you willing to pay to go to the doctor for regular health-cancer checks?
Lets' consider this example: look at the labor market compensation for fatality risk:
- Job : annual fatality risk: , Salary:
- Job : annual fatality risk: , Salary: workers are paying to reduce fatality risk by .
If we consider 100 workers, 1 life would be saved statistically, so we can derive:
Structural model, in this context, often rely on VSL to estimate the impacts of a factor.
For example, the APEEP (AP2, AP3) Model analyzed the total PM2.5 mortality health damages caused by each sector in the US economy, with the following steps:
- models pollution emissions from almost 10'000 sources across US
- models each flow of pollution present in each county, independently on where the pollution originates
- combines demographic data for each county with pollution, using a Dose-Response function to estimate how pollution correlates with mortality. For example:
- translate mortality impacts into monetary terms based on the VSL approach.
Economists generally prefer looking at what people do instead at what people say (revealed preferences vs stated preferences).
Example: the hypotetical biasis: people generally exaggerate their willingness to pay for enviromental protection.
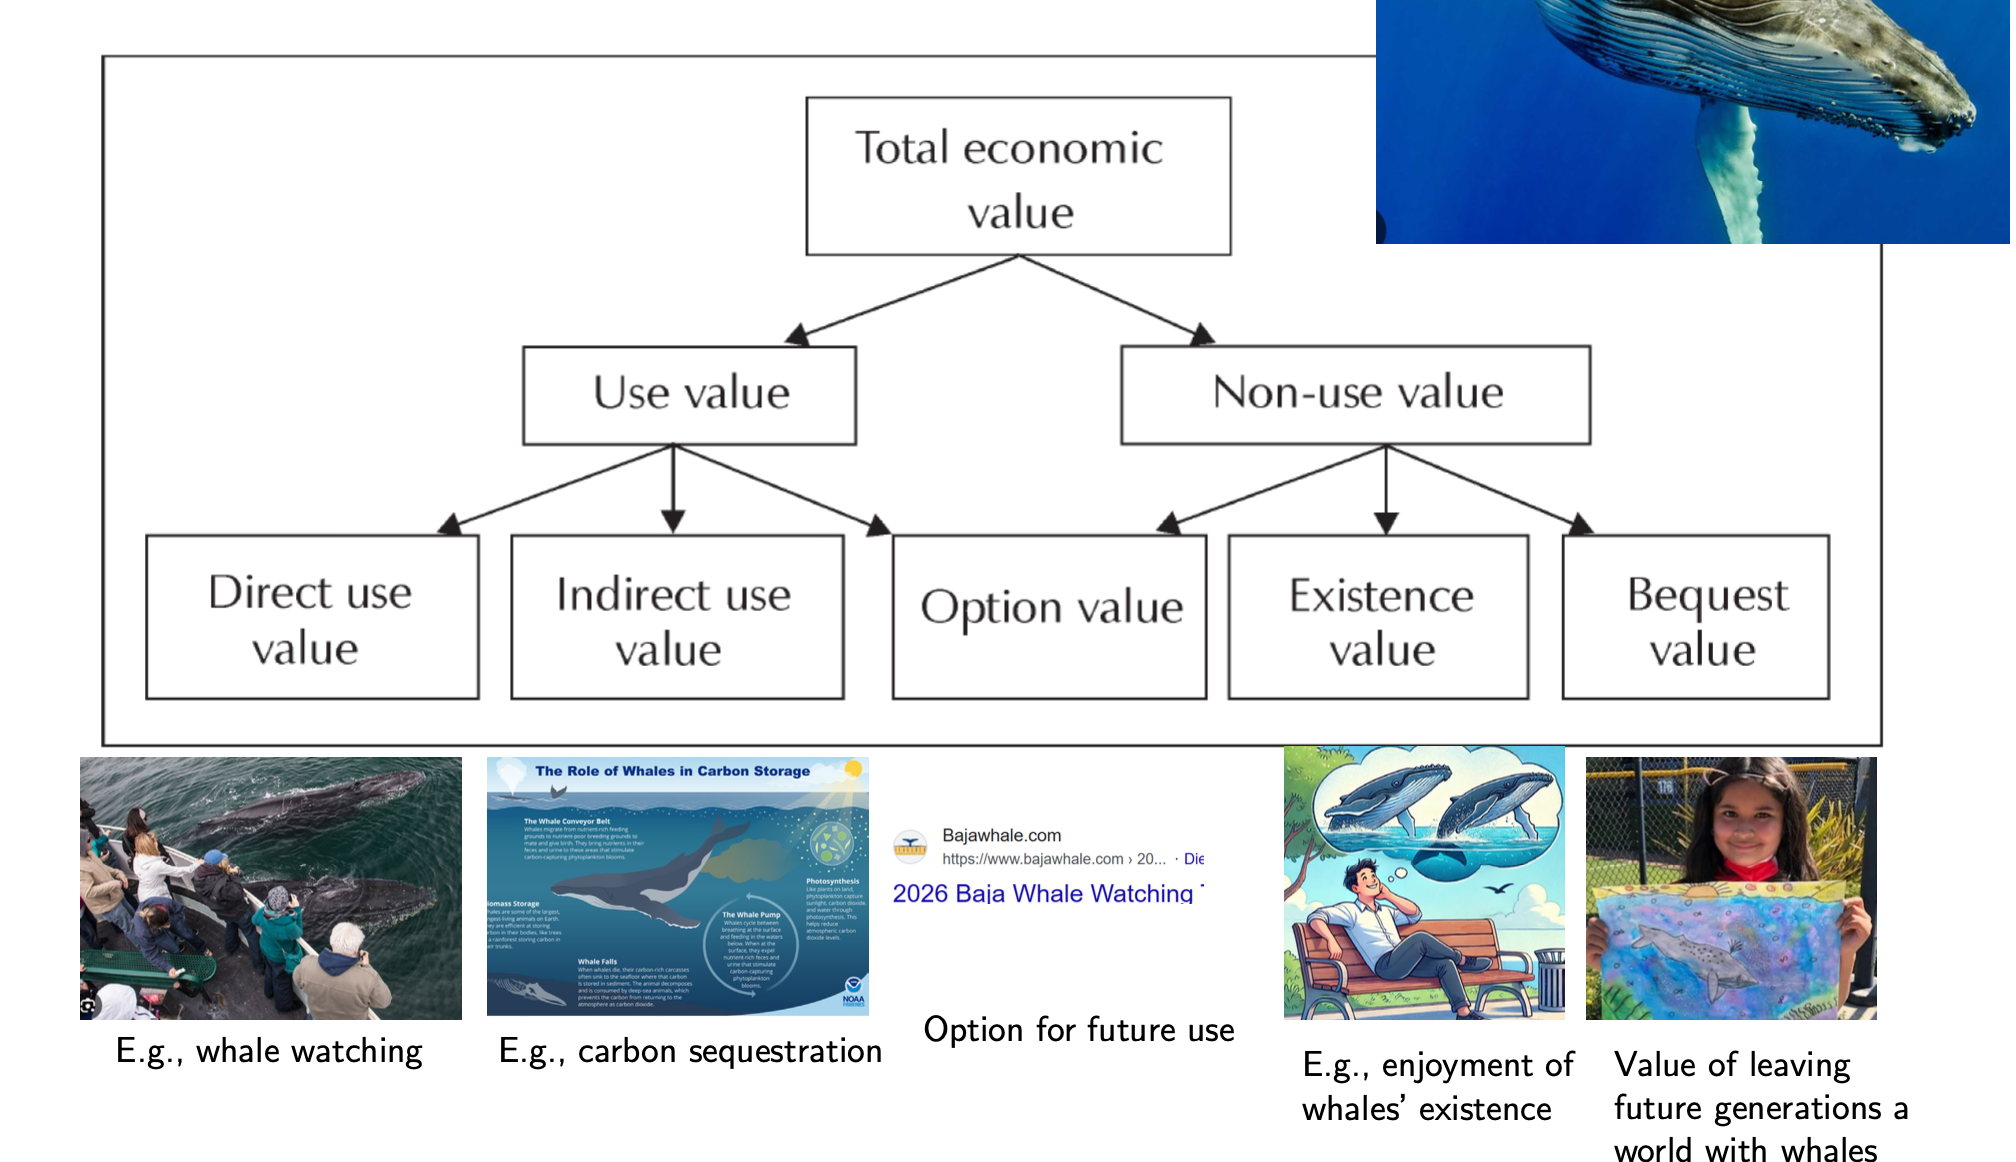
However, in some csases surveys can still be useful.
Consider this example: the non-use values for specific species (how do you value the life of 250'000 sea birds killed by a oli company?)
Contingent valuation (CV) is a highly structured survey used to understand values for very specific good and scenarios.
4. Quantifying the Market Value of Firms’ Sustainability Investments – Part 2
One common metric to classify how much a firm is sustainable is the ESG (enviromental, social, governance) Rating.
ESG rating method may differ across providers and they are usuaolly proprietary up to some level but, while credit ratingds from different providers show high correlation (), correlation of ESG ratings is lower ()
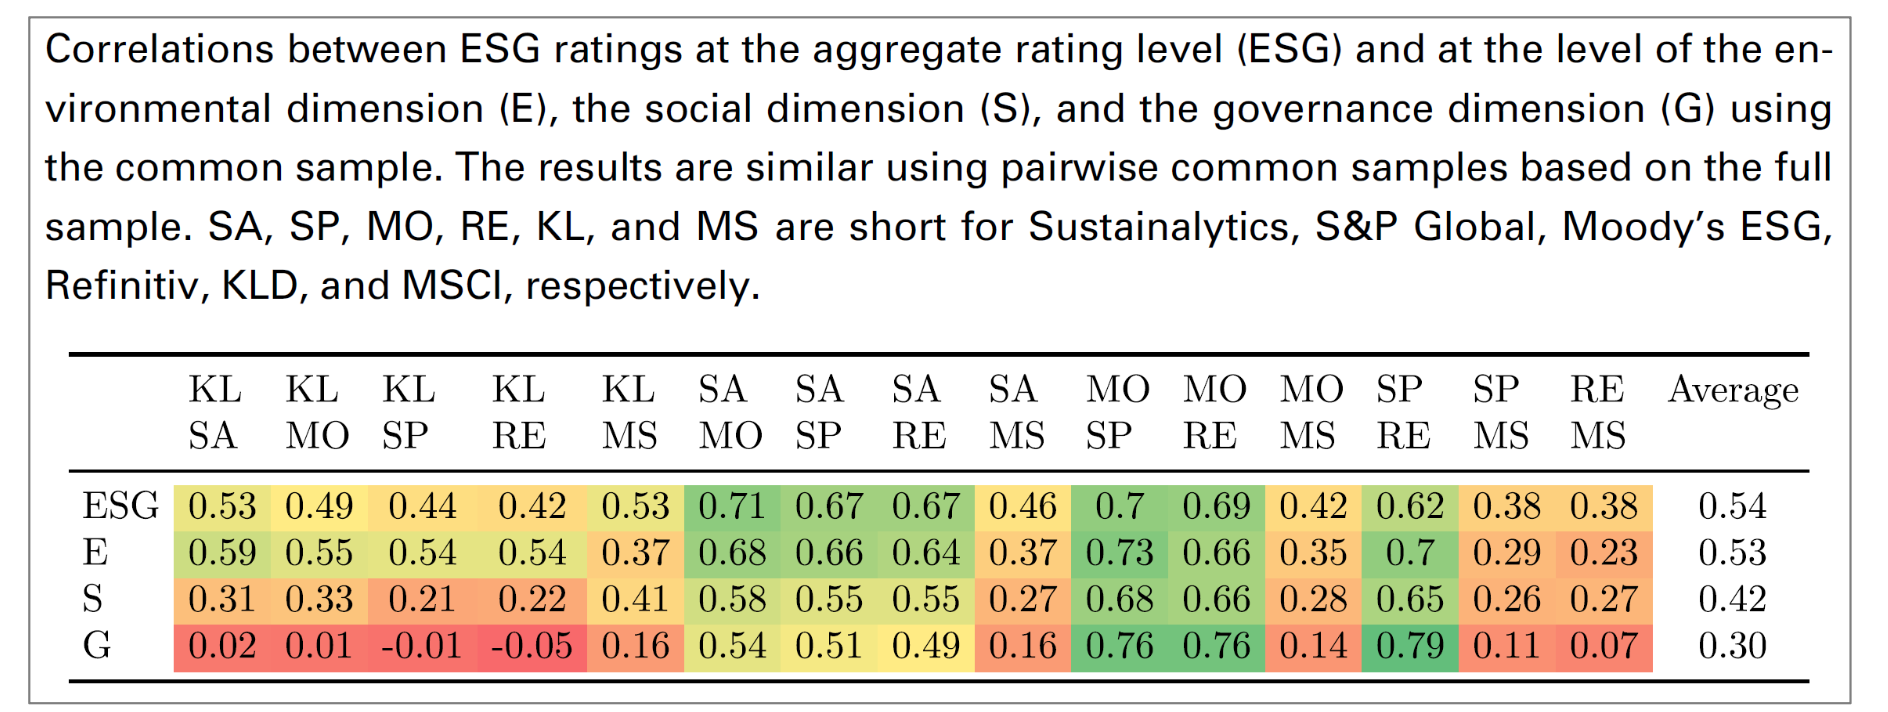
This disagreement comes from different factors:
- different agencies consider different attributes (38% od the divergence)
- different agencies measure same attributes with different methods :(56% of divergence)_
- different agencies weight them differently (6% of divergence).
A potentially more objective and more directly climate-relevant indicator may be the firm's carbon emissions.
- Scope 1: direct emissions: emissions from the firm's production (the apprea highly consistent across data providers).
- Scope 2: indirect emissions: emissions from purchased heat, electricity, stea, cooling etc (slightly less but still highly correlated across providers).
- Scope 3: indirect emissions from productio of purchased materials, activities and services (data are more noisy, substantial disagreement).
However, often the carbon emissions are not a good indicator of how much a firm is green.
For example, firms with higher carbon emissions and low ESG scores are also the most active innovators in low carbon technologies.
Another potential solution is to measure greenes at the product level.
Cost of Capital
How can we distinguish the effects of firm sustainability from potential other factors (such as skilled management or external factors)?
If we collect data on corporate bonds spreads (measure of borrowing costs or cost of capital) and ESG scores, we can estimate the following specification:
is the "Sustainability" factor, in other words it is the coefficient that tells you the relationship between the overall spread and the ESG ratings. If is negative and statistically significant, it suggests that as ESG scores go up, borrowing costs go down.
Carbob Offsets
The basic intuition behind this strategy is that if some other firms can reduce their gas emissions cheaper than a specific firm, that firm could pay the others to reduce its emissions, so everyone can benefit. (Indeed, many companies use carbon offsets to hekp neutralize carbon emissions that are very expensive or impossible to eliminate).
Some possible negative consequences:
- Rebound effect: people may increase energy/resources consumètion in response to the offset.
- Lack of additionality: the "paid"/sold emissions would have been reduced even with out carbon offset program payments.
- Carbon Leakage: tree planting in one country may increase emissions inn other countries throguth displacement of agricultural land and increase imports.
Market Valuation of Firm Sustainability: Insights:
With these challenges and potential problems in mind, let's study 5 general insights on indirect benefits behind sustainability:
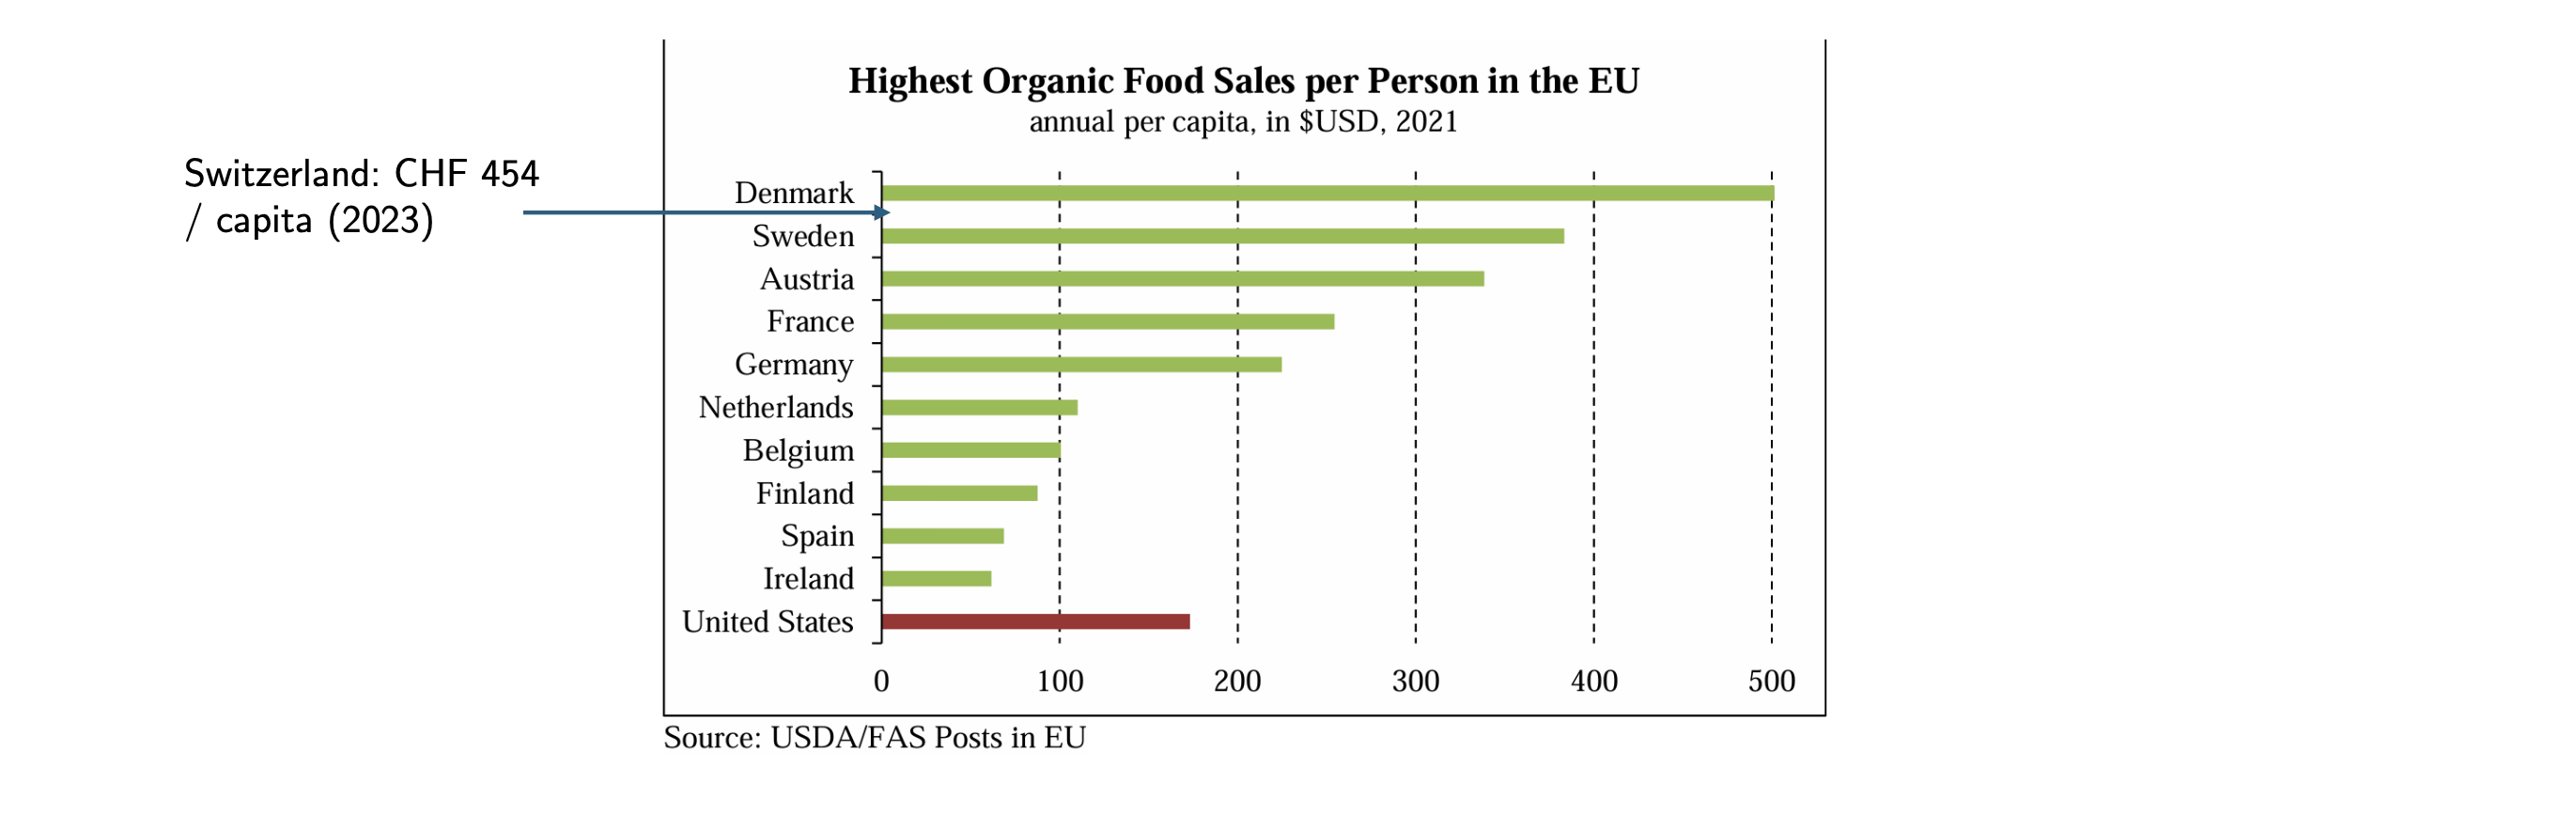
- (Some)Consumers are often willing to pay more for sustainable products. Intuitively, this is easy to observe with products that differ only from an enviromental point of view (same price, dimension, quality etc...). Also note that estimating demand curves (how demand changes depending on sustainability) may be very difficult and require lot of data.
For example, in Switzerland, organic products have around share of the total grocery expenditure, very high compared to the rest of Europe.
-
Consumers are not always willing to pay more, especially for CO2 emissions reductions or offsets. For example, considering 64k online bookings at a Swiss Airlin where of the buyers could have paid for "carbon tax/offset" for less than EUR/Ton, only actually offset their emissions. The median willingness to pay for offsets as EUR.
-
Consumers sometimes respond even to unverified claims of greeness, providing incentives for green-washing.
-
Labor recruitment and retention may benefit fro corporate social responsibility, even if evidence is still limited. This is particularly hard to proove since more sustainable firms may also have better management and other reasons why they might have better labor outcomes. However, experimental evidence shows that kobs seekers (on average), give importance to ESG signals.
-
Capital costs are likely lower for more sustainable firms, even if evidence is mixed. In 2021, for example, Bolton and Kapcerzyk analyze the associatoin of firm's carbon emissions and stock returns in the US:
(However, it is not clear what measure for carbon emissions is the best for this use).
The study prooved that there's an increasing risk premium based on emissions levels:
- Scope 1 Total Emissions annual increase in stock return
- Scope 2 Total Emissions annual increase in stock return
- Scope 3 Total Emissions annual increase in stock return
However, the study failed to capture significant effect of carbon emissions intensity (emissions per unit of sales).
5. Market Value of Firms’ Sustainability Investments
In the last chapter, we saw tha there's some evidence that greener firms may face lower capital costs.
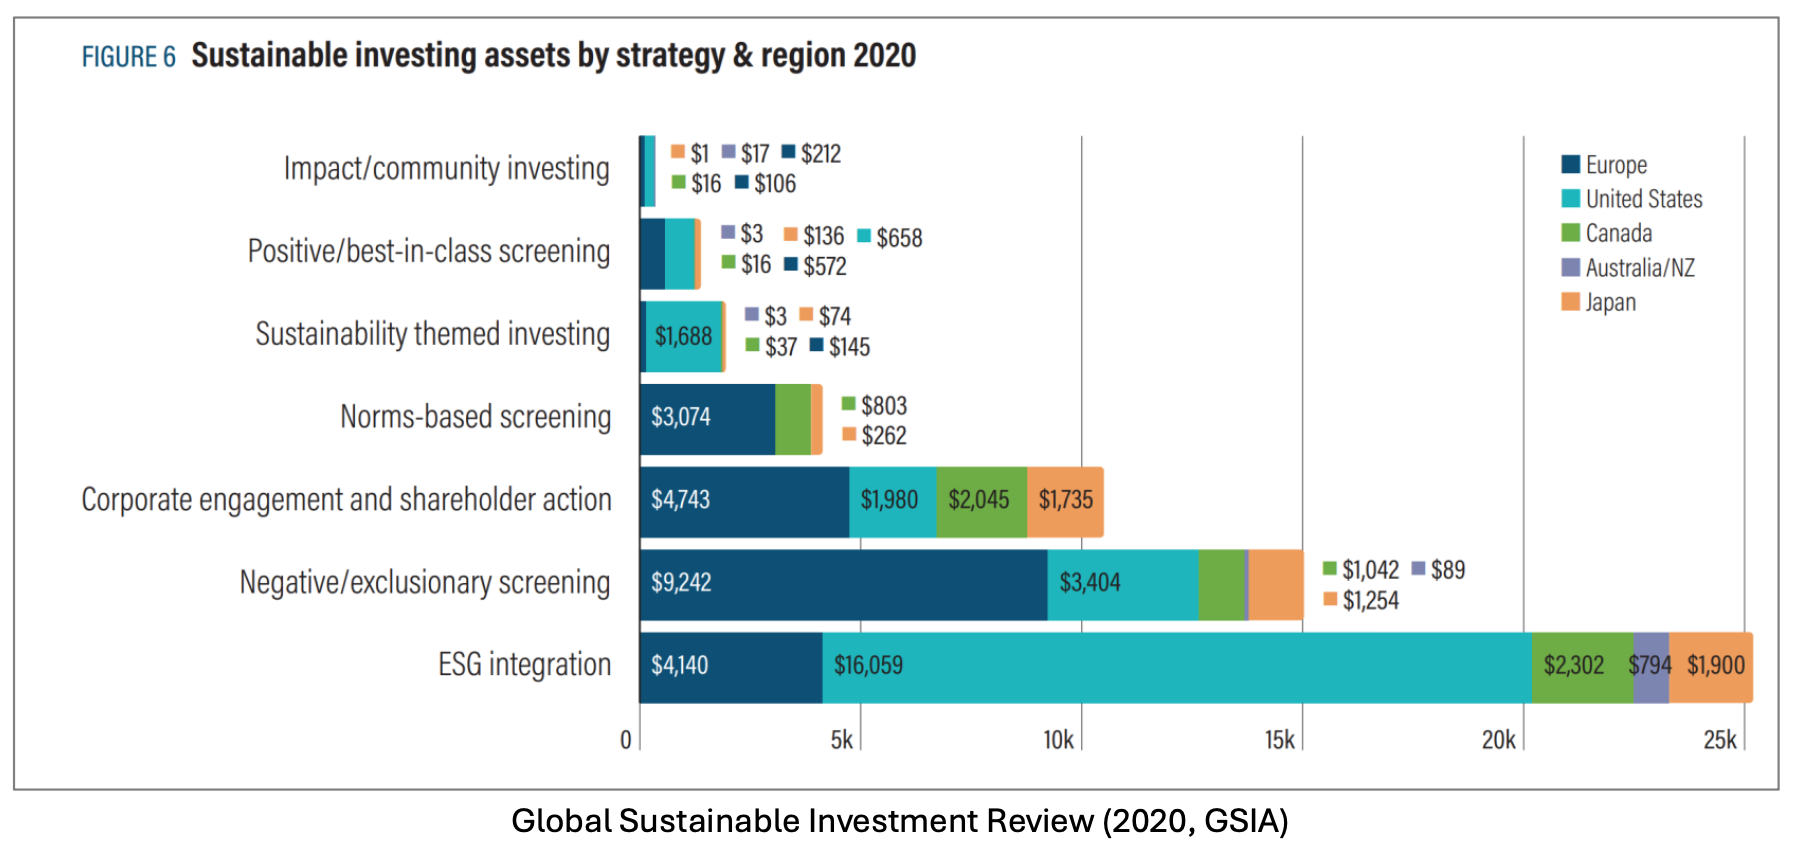
According to the Global Sustainable Investment Alliance, in the last years, there has been a increasing trend in sustainable investments:
- global sustainable investment grew from 2016-2020, reaching around trillion dollar.
- of AuM is made by sustainable investments in 2020.
- "Green bonds", issued to support specific enviromental projects, represent also a growing market (even if the methods to certificate them is still challenge).
So, if some investors prefer "green securities" and there are enough of them, green investments may lower the cost of capital, leading to two potential outcomes:
- cause greener firms to growth relatively more (growth effect)
- incentivize firms to become greener (reform effect).
Consider thenm the following Partial Equilibium profit-maximization model.
Consider any firm maximizing profits by choosing capital with cost , labor with wage-cost , fossil energy with energy price :
Without green investors, if we normalize the price to and hold labor constant for an easy rappresentation, we obtain the following simplication:
that, if we put the partial derivatives of the profit function equal to zero, brings to the following maximizing conditions:
That, in ecomomic terms, translates into:
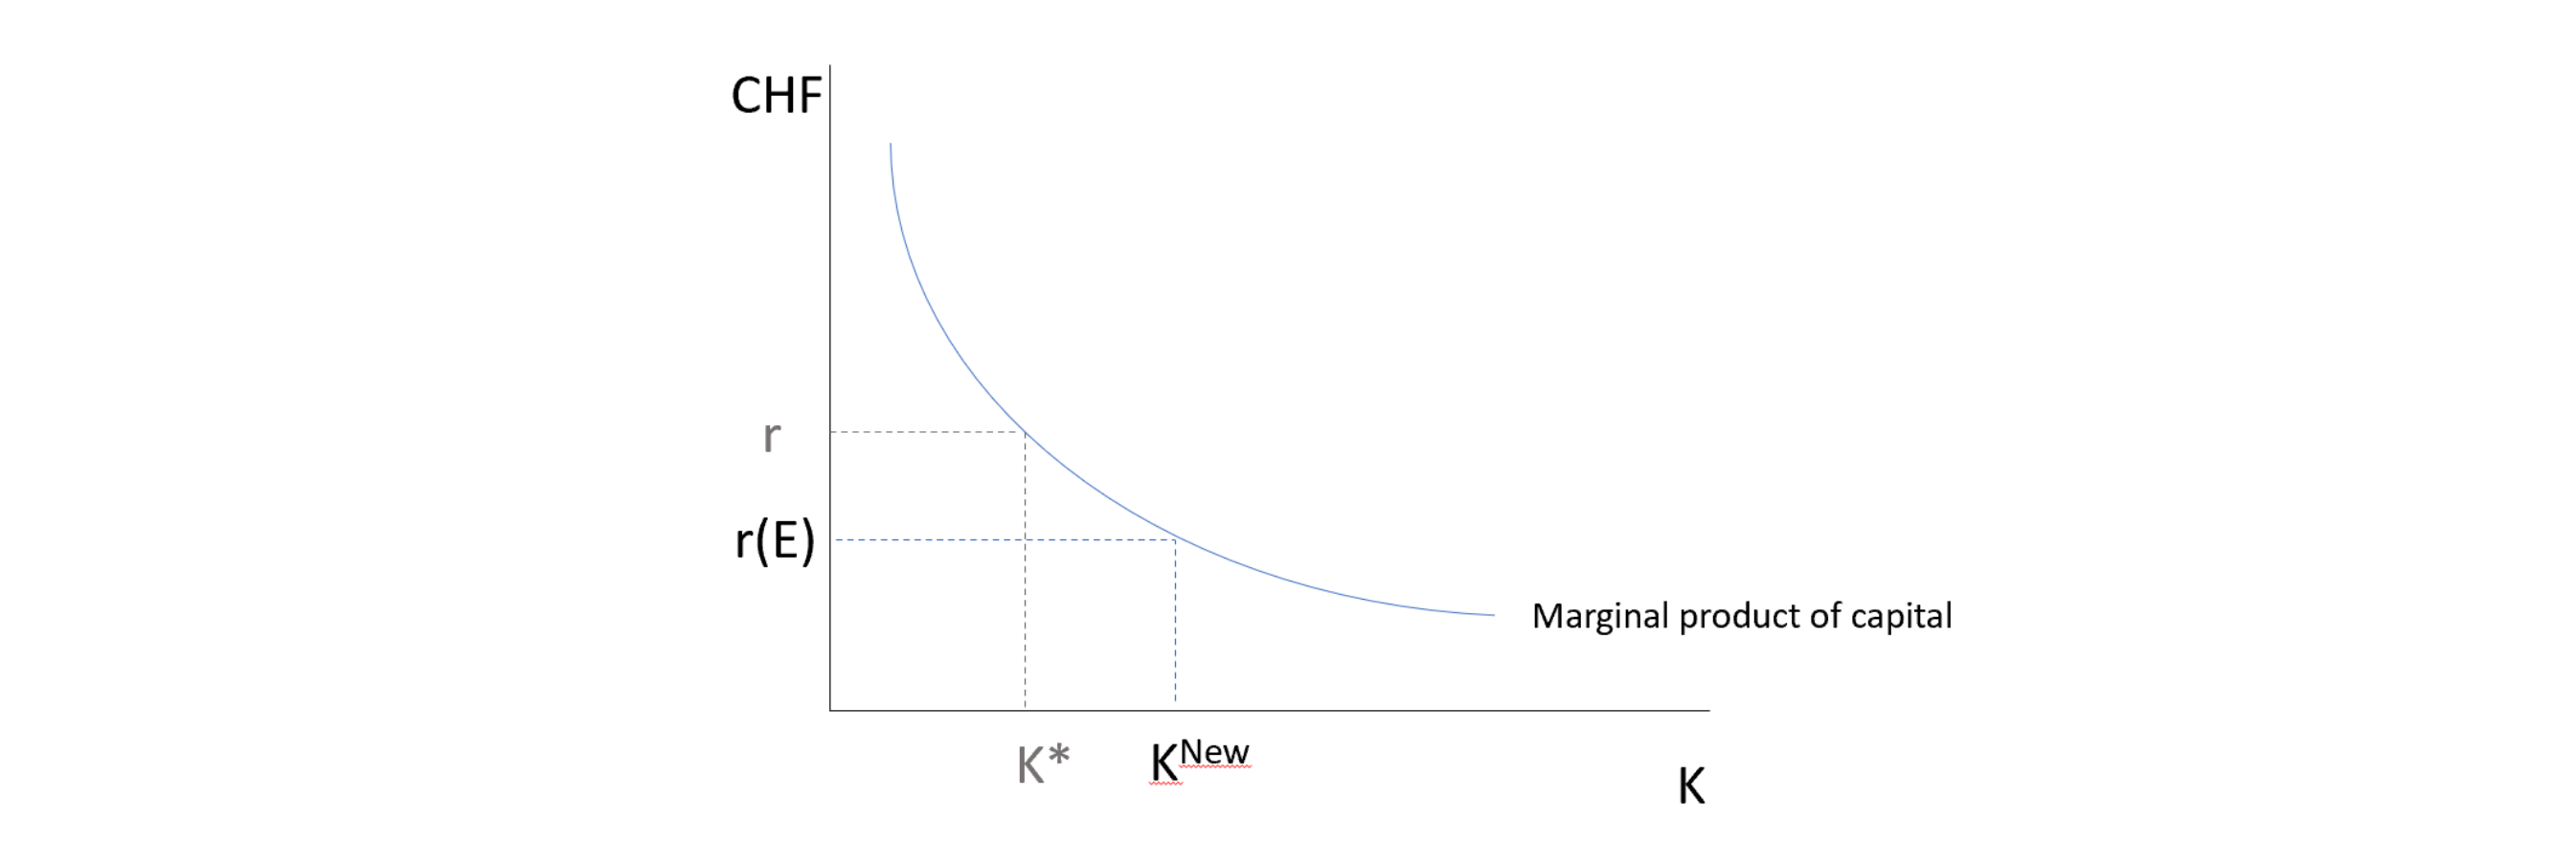
(Generally speakiog, we assume that, holding other inputs costant, the marginal product of capital is decreasing).
We now introduce green investment, by saying that green investors can lower capital costs. For example, (cost of capital) may become an increasing function of the energy consumption :
In this case, the maximizing conditions become:
If then a firm is green enough to face lower capital cost , we would expect to increase its capital investments, resulting in the growth effect:
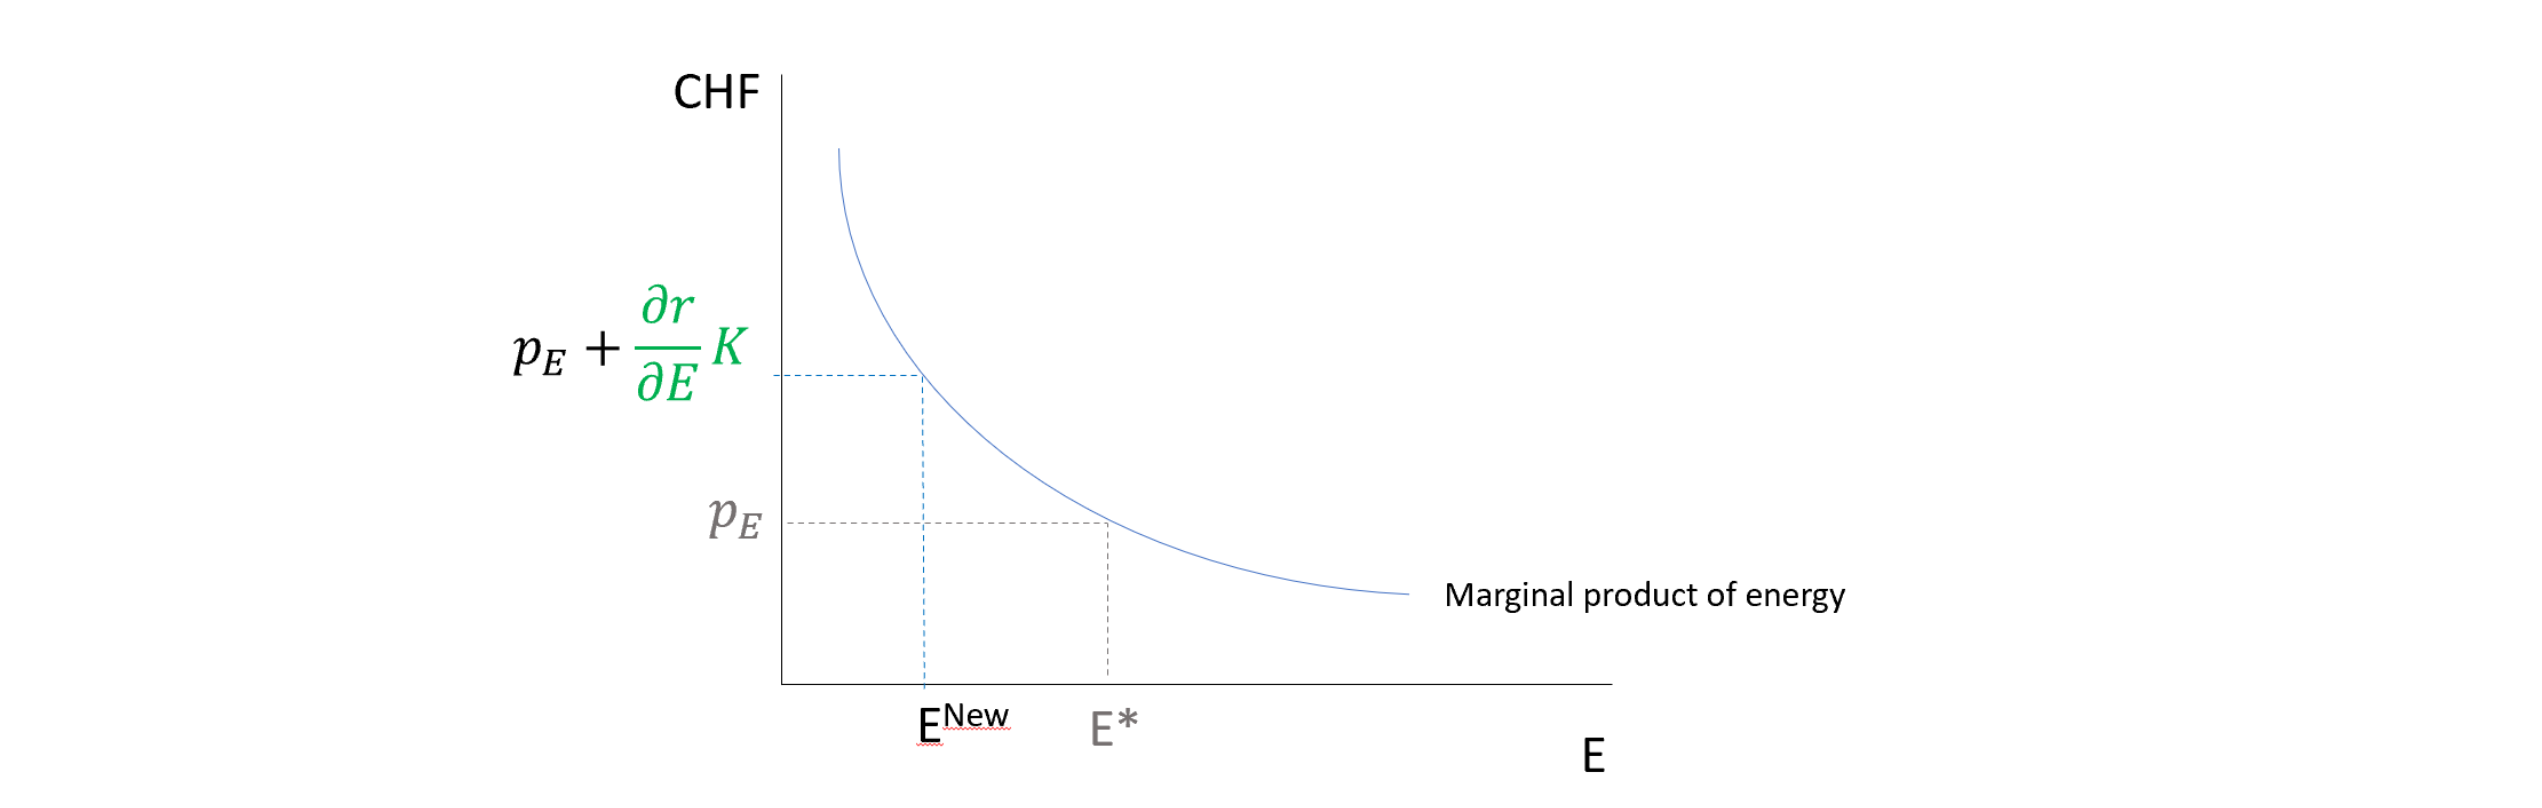
Furthermore, the new equilibrium coming from the marginal product of fossil energy acts an an effective tax on fossil inputs, incentivizing firms to reduce the use of fossil energy (reform effect).
But... _how do esg rating changes affect who owns shares in a firm?_A
Recent research shows that ESG funds and individual investors are reponsiveto their mandate:
- 2 years after a rating upgrade higher ownership
- 2 years after a rating downgrade lower ownership
However, changes in the ESG ratings do NOT affect firms' ESG strategy and actions.
Florian Berg shows then that, while stock market and ESG asset managers are sensible to ESG rating upgrades/downgrades, there's no evidence that these have some economic impact.
3 stylized facts about Capital Costs, Sustainability and Enviromental Risks
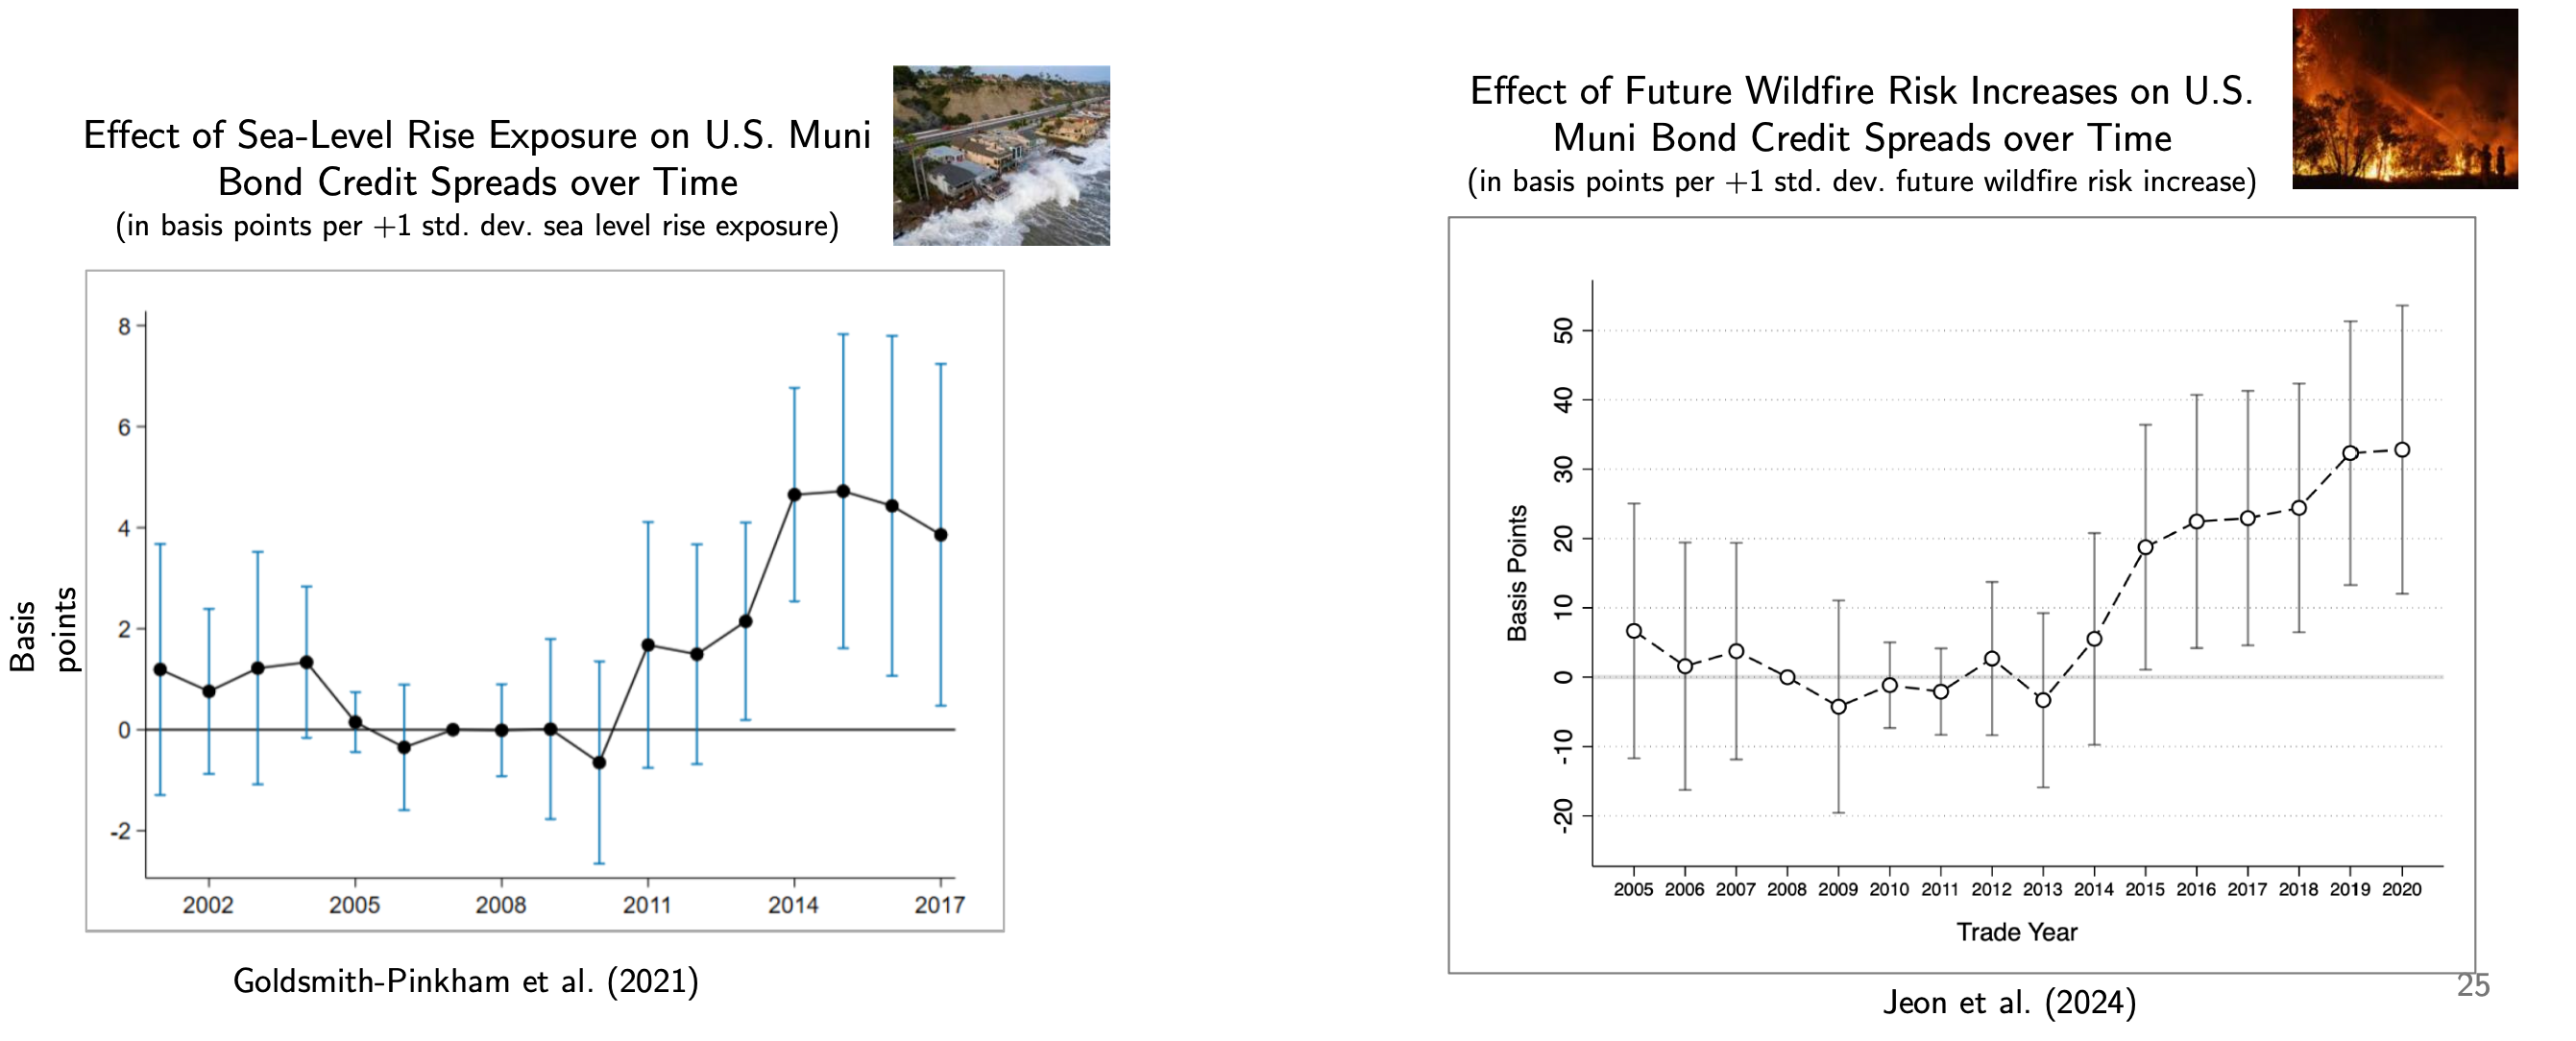
-
Climate risk effect on borrowing costs has been increasing in both slope and magnitude ( cost of debt is rising for entities highly exposed to climate risk).
-
Climate risk capitalization remains incomplete in many markets ( financial markets have not yet fully priced the true cost of climate change into asset values)
- Example: consider two identical homes in the same location, but one is more exposed to flood risk then it should be priced less thanks to the presentvalue of future insurance/flood costs. However, often one key issue in similar scenarios is that there are limited information regarding enviromental risks.
-
Climate risk effects can be incorrectly measured by conventional methods that rely on historicla data.
- often there no measure of an asset's physical climate and enviromental risk exposure
- climate risks are correlated with other factors for asset prices.
6. Costs of Sustainability Investments: Basics
Accounting vs Economic Cost- Accounting cost: actual expenses + capital depreciation
- Economic cost: social cost of utilizing resources (taking into consideration also the opportunity cost)
Marginal vs Average Cost
- Average cost: _cost per unit produced ()
- Marginal cost: _cost of an additional unit produce ()
In sustainability, we already mentioned marginal cost considering the abatement cost curves, representing the costs of redcution of emissions by an additional ton.
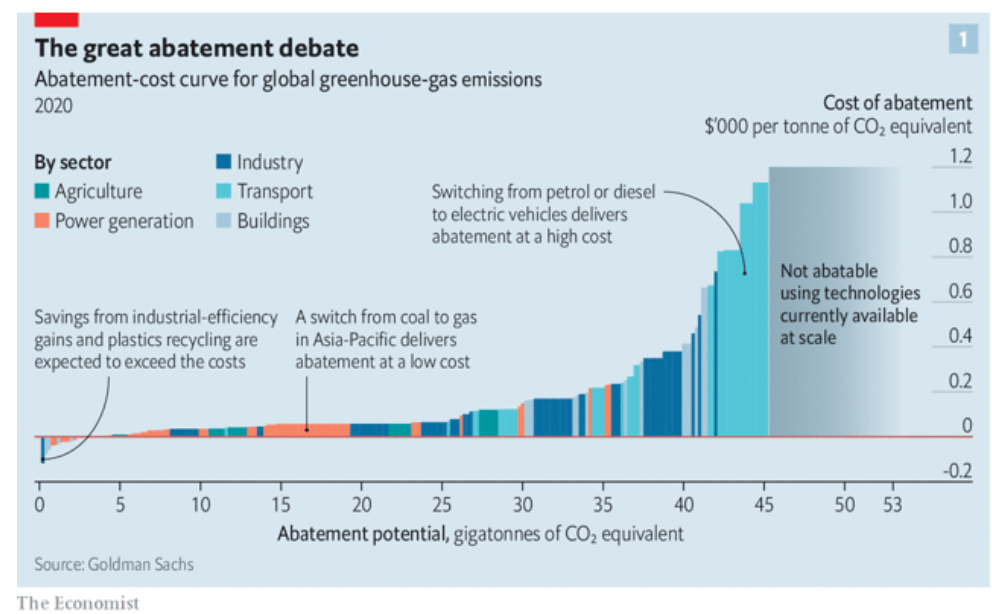
The curve, given the actual technologies and resources, order all the actions we can do, from the cheapest to the most expensive, to reduce emissions.
Also, te curve takes into consideration negative costs.
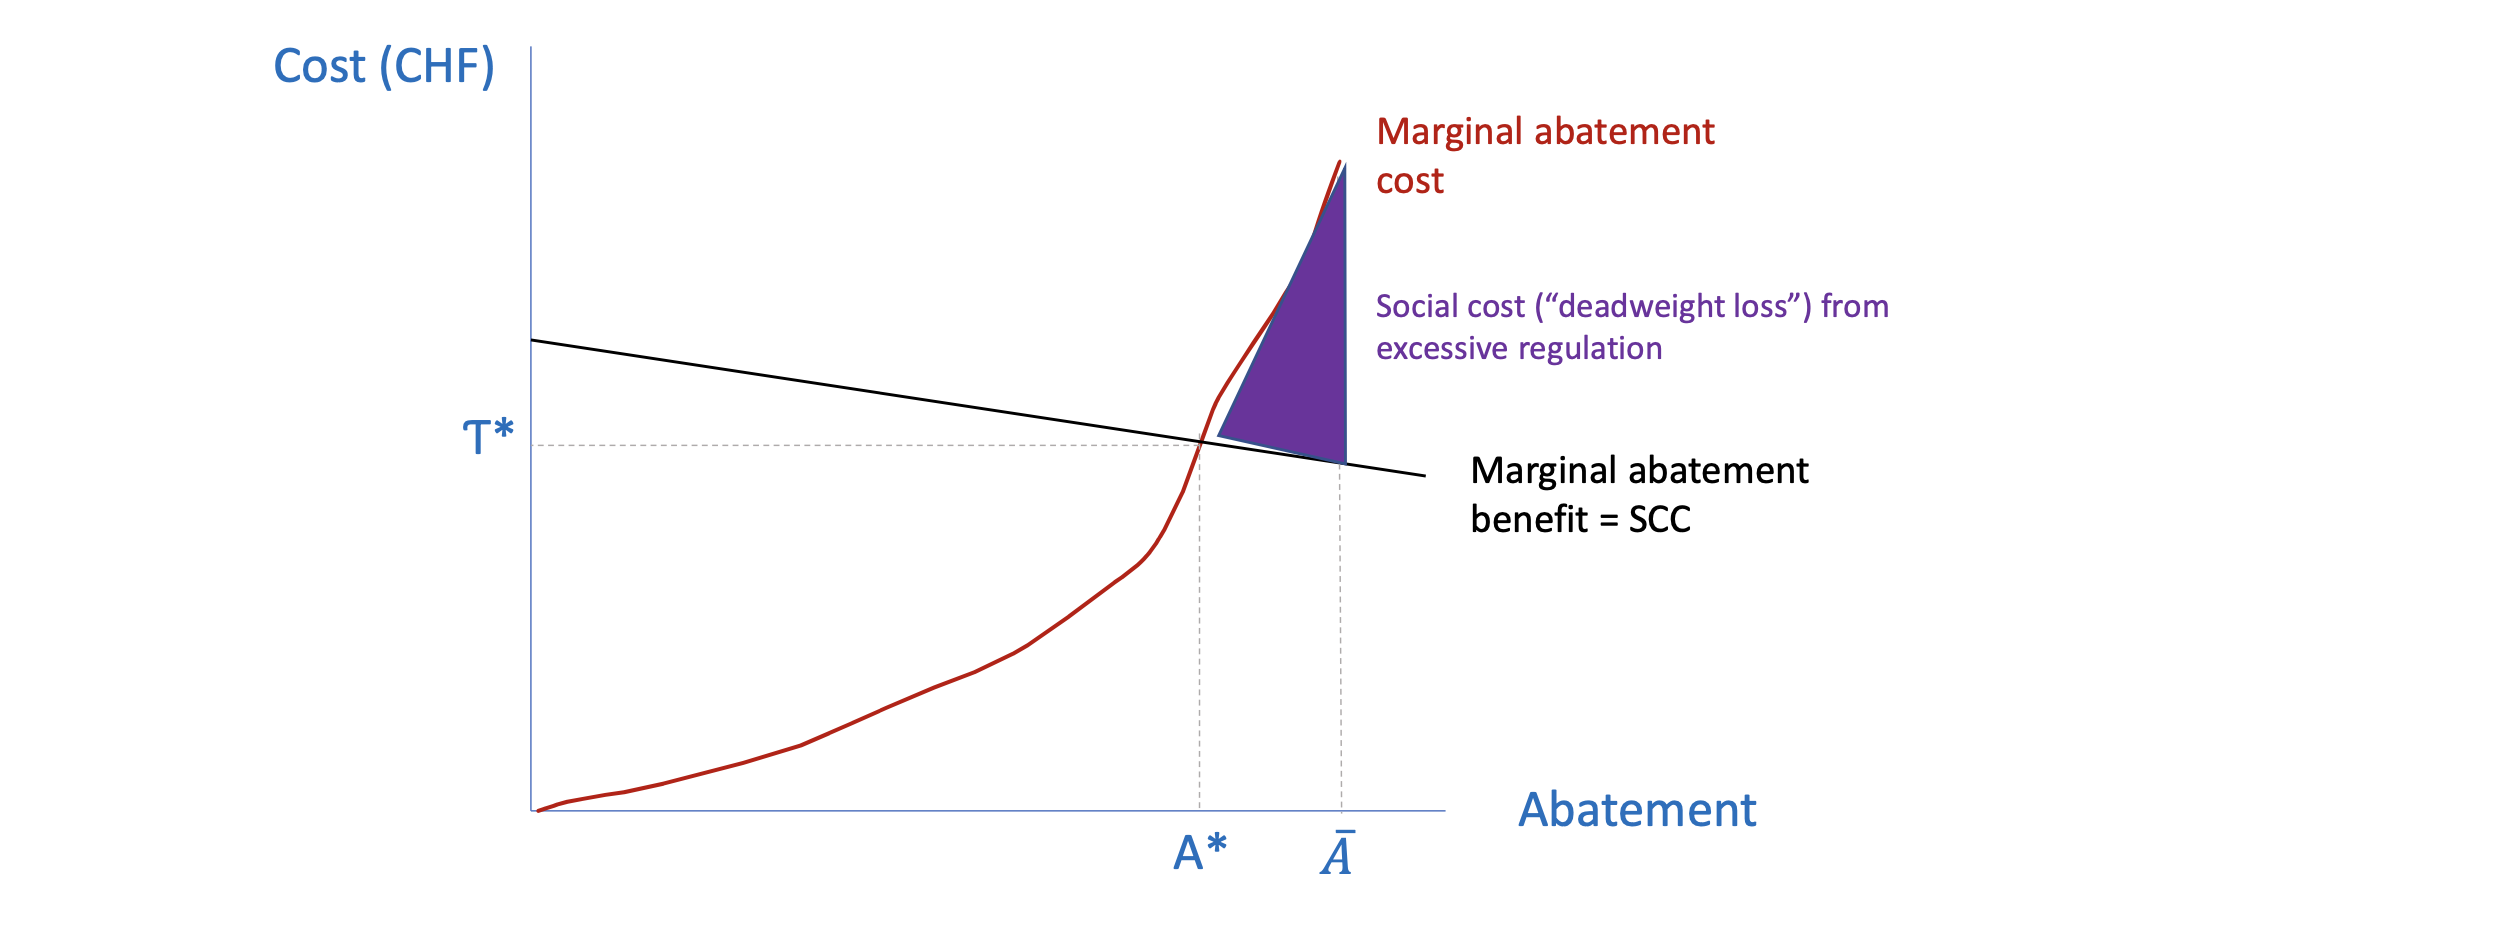
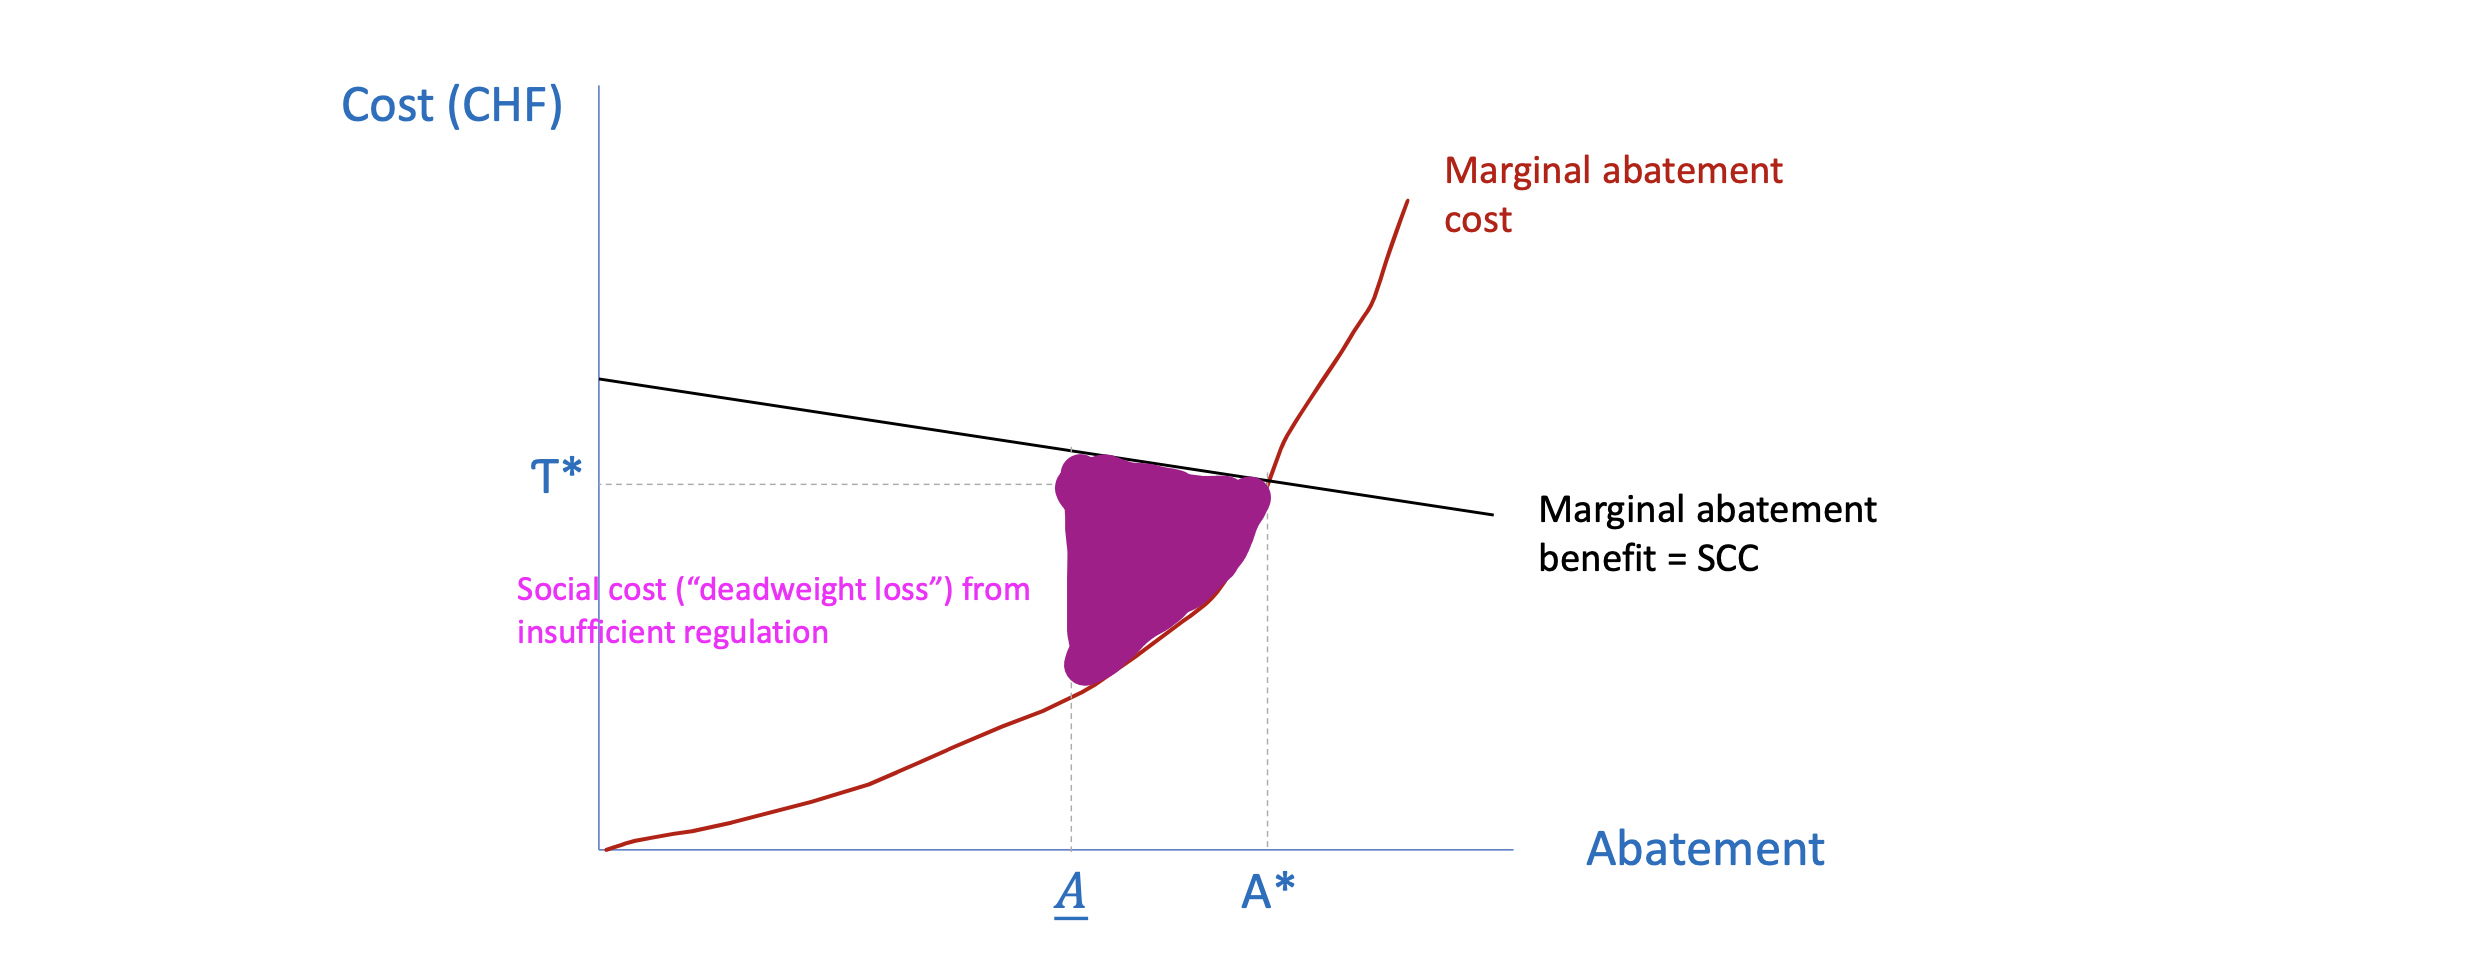
(Teorically, we could draw the marginal-benefit curve in the first initial abatement graph to understand where the optimal equilibrium lies, however, costs and benefits are really dinamic and hard to solve).
Static vs Dinamic Costs- Static costs: costs of a specific project (could be measured via present discounted valoue)
- Dinamic costs: overall costs of a project, including future effects and spillovers (learning-by-doing, scale effects, positive externalities etc...)
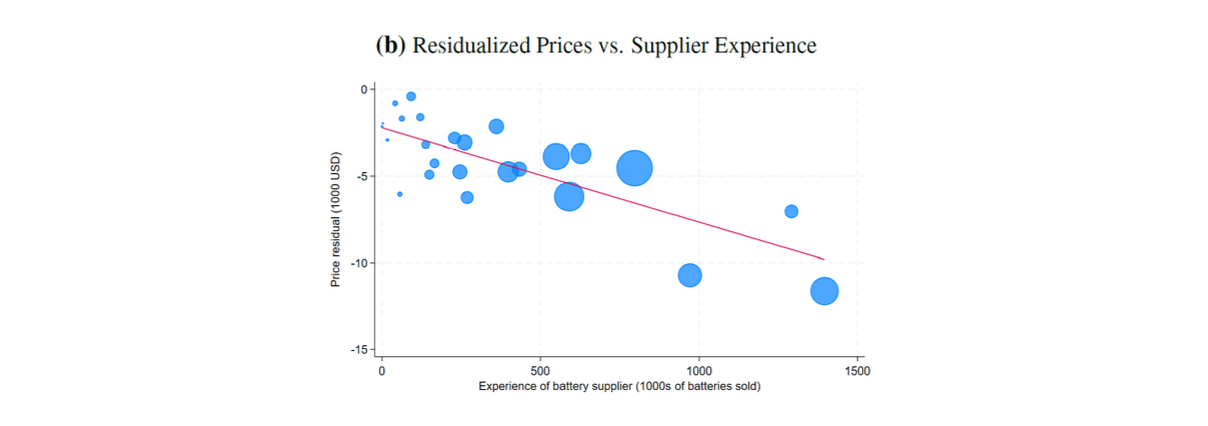
Example: in the wird-turbines sector, doubling manufacturing experience lowers costs by .
However, note that the costs reduction can be given by two factors (correlation causation): increase in experience or increase in supply, so it's hard to draw conclusions.
- Partial equilibrium: focus on one market in isolation
- General equilibrium: consider effects on other markets.
Example: airline depaiting bunying sustainable aviation fuel:
- PE cost: extra cost of sustainable aviation fuel (fuel cost only)
- GE cost: _also consider changes in cost of labor and capital cost (it this change attracts workers/investors)
Levelized Costs
How can we measure the costs of different electricity generating technologies in a comparable way?
The levelized cost is the (constant, real) price of power that would equate the net present value of revenue from a plantís output with the net present value of the cost of production.
Assuming that a plant existas for periods and produces units per period , the present value of costs is:
were is the cost of producing in period including also the capital costs.
With the same assumptions, the net present value of revenue is:
If we equate the expressions we can solve for :
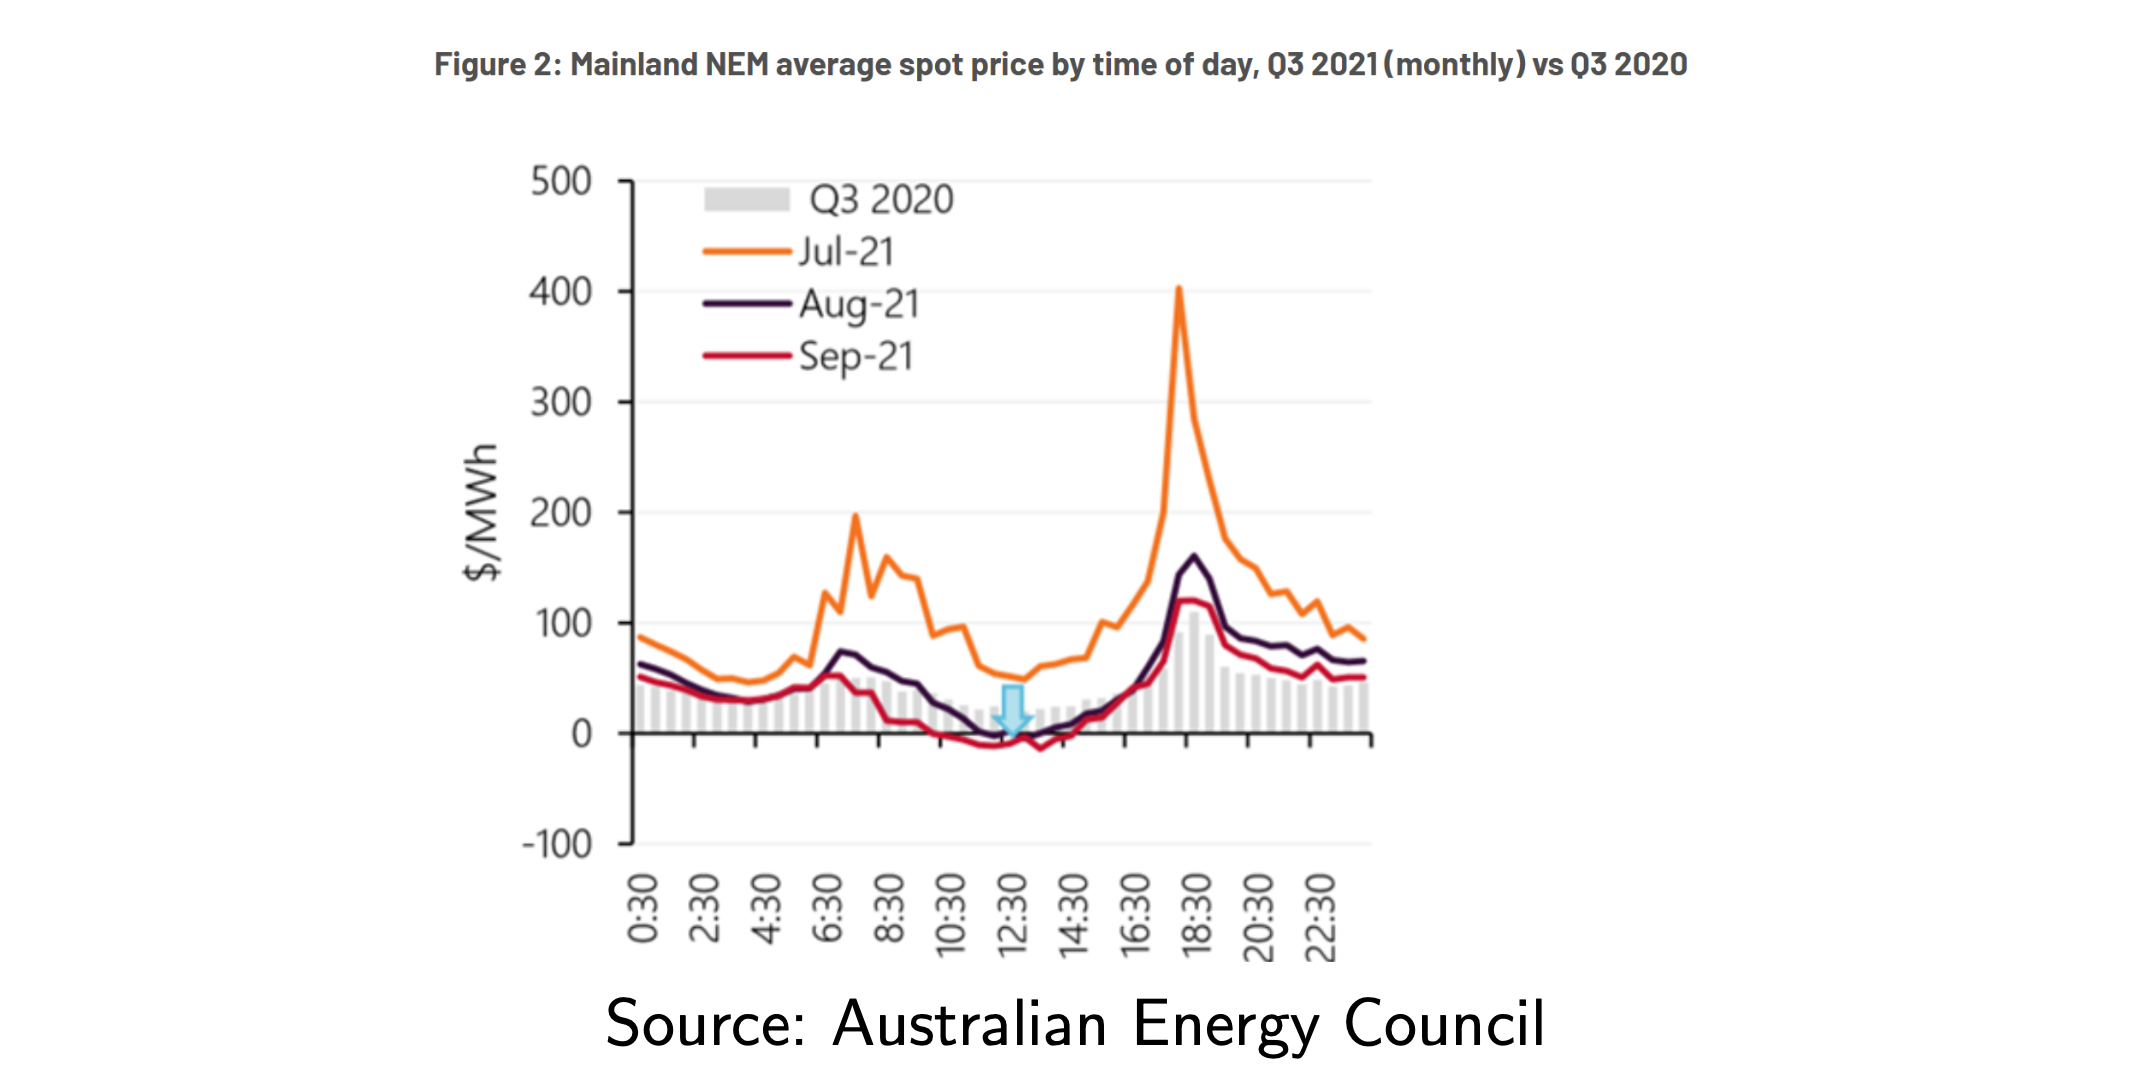
The LCOE (levelized cost of energy) provides a easy way to compare cost of energy... but, there are two key facts about the electricity market that we must consider:
- it's costly to trasport and store
- demand is higly volatile in space and time
.The value of electricity depends critically on the timing, location, and controllability (dispatchability) of its production.
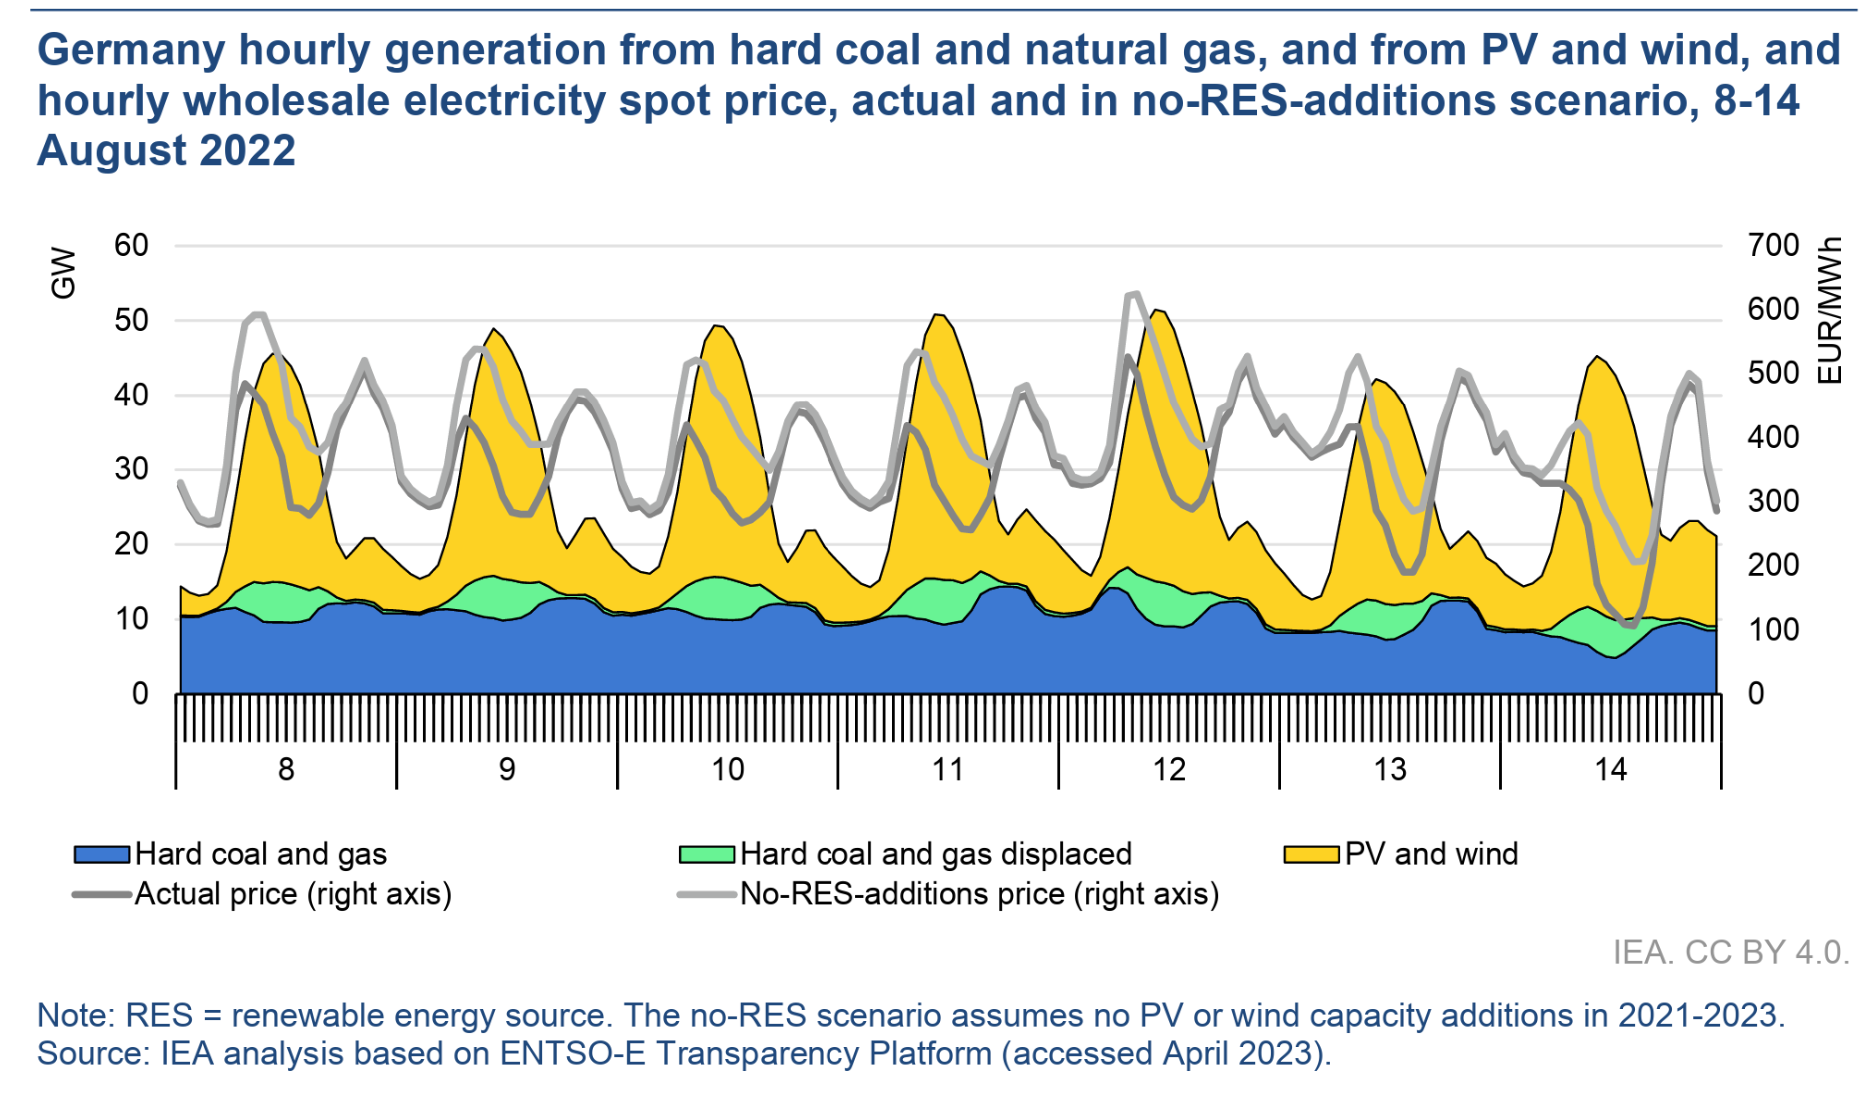
With increasing share of variable resources sources, some markets show zero or negative spot prices for electricity.
Sould subsidies and tax beneifts be included in the estimation?
- from private (investor) perspective: yes
- from public (economist) perspective: no
Should externalities be included in LCOE?
- Public (economist) perspective: yes
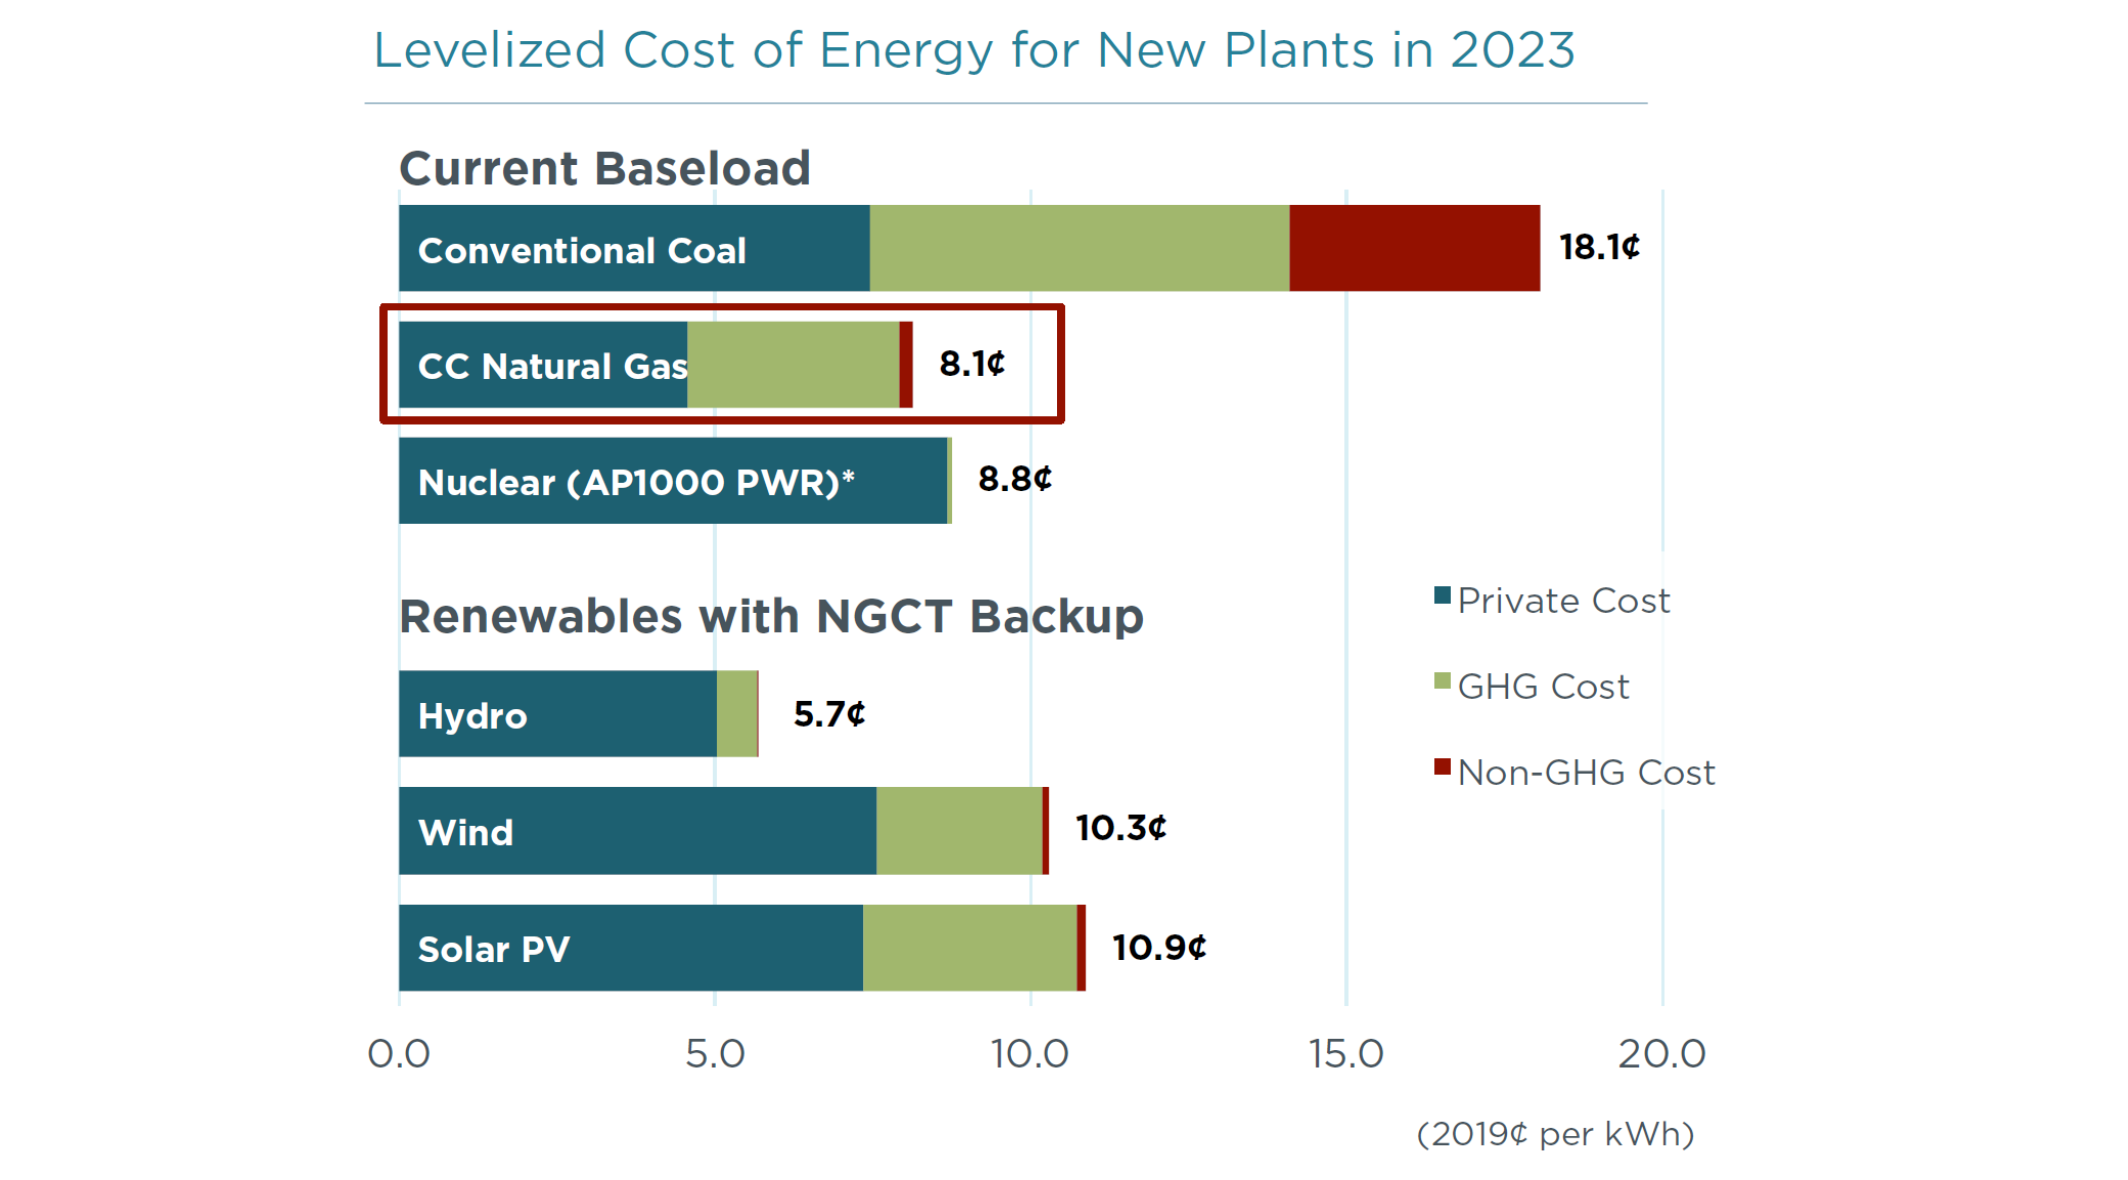
Note: GHG cost: greenhouse gas emissions cost, Non-GHG: particulate matter.
7. Firm’s Capital Costs, Sustainability, and Environmental Risks
9. Welfare Economics
Economics studies human behaviour as a relationship between ends and scarce means which have alternative uses.
Sustainability Economics tries to iudnerstand and manage the long-term relationships between humans and nature so that scarse enviromental goods, and their human-made substitues or complements, are being used efficiently for achieving the normative goals of:
- satisfaction of the needs and wants of individuals.
- justice, including justice between humans of same and different generations and between humans and non-human nature
The sustainability challenge implies meeting basic needs today while safeguarding opportunities for future generations:
All market equilibria (in a ideal-utopian market) are Pareto-efficient.
Second Fundamental Theorem of Welfare EconomicsAny Pareto efficient allocation can be achieved as a competitive equilibrium through a suitable redistribution of initial endowments, allowing for a separatio of efficiency and distribution concerns.
as the conditions for a perfect market are not usually satisfied, governmental actions should be considered.
In particular, economic policy is both needed to correct market failures:
- too little internalization of external effects
- too little provision of public goods
- distorted competition due to market power or information asymetry
or to enable a "fair" distribution between:
- humans of different generations (intergenerational justice)
- humans of the same generations (intragenerational justice)
- humans and the non-human nature (interspecies justice)
To select and analyze the right economic policy, we firstly need to define a moral compass (moral theory):
- Consequentialism: justed the moral worth of the effects of an action.
- Deontological values: focus on judjing the actions themselves.
- Virtue Ethics: considers as the right action what a virtuout person whould do in that scenario.
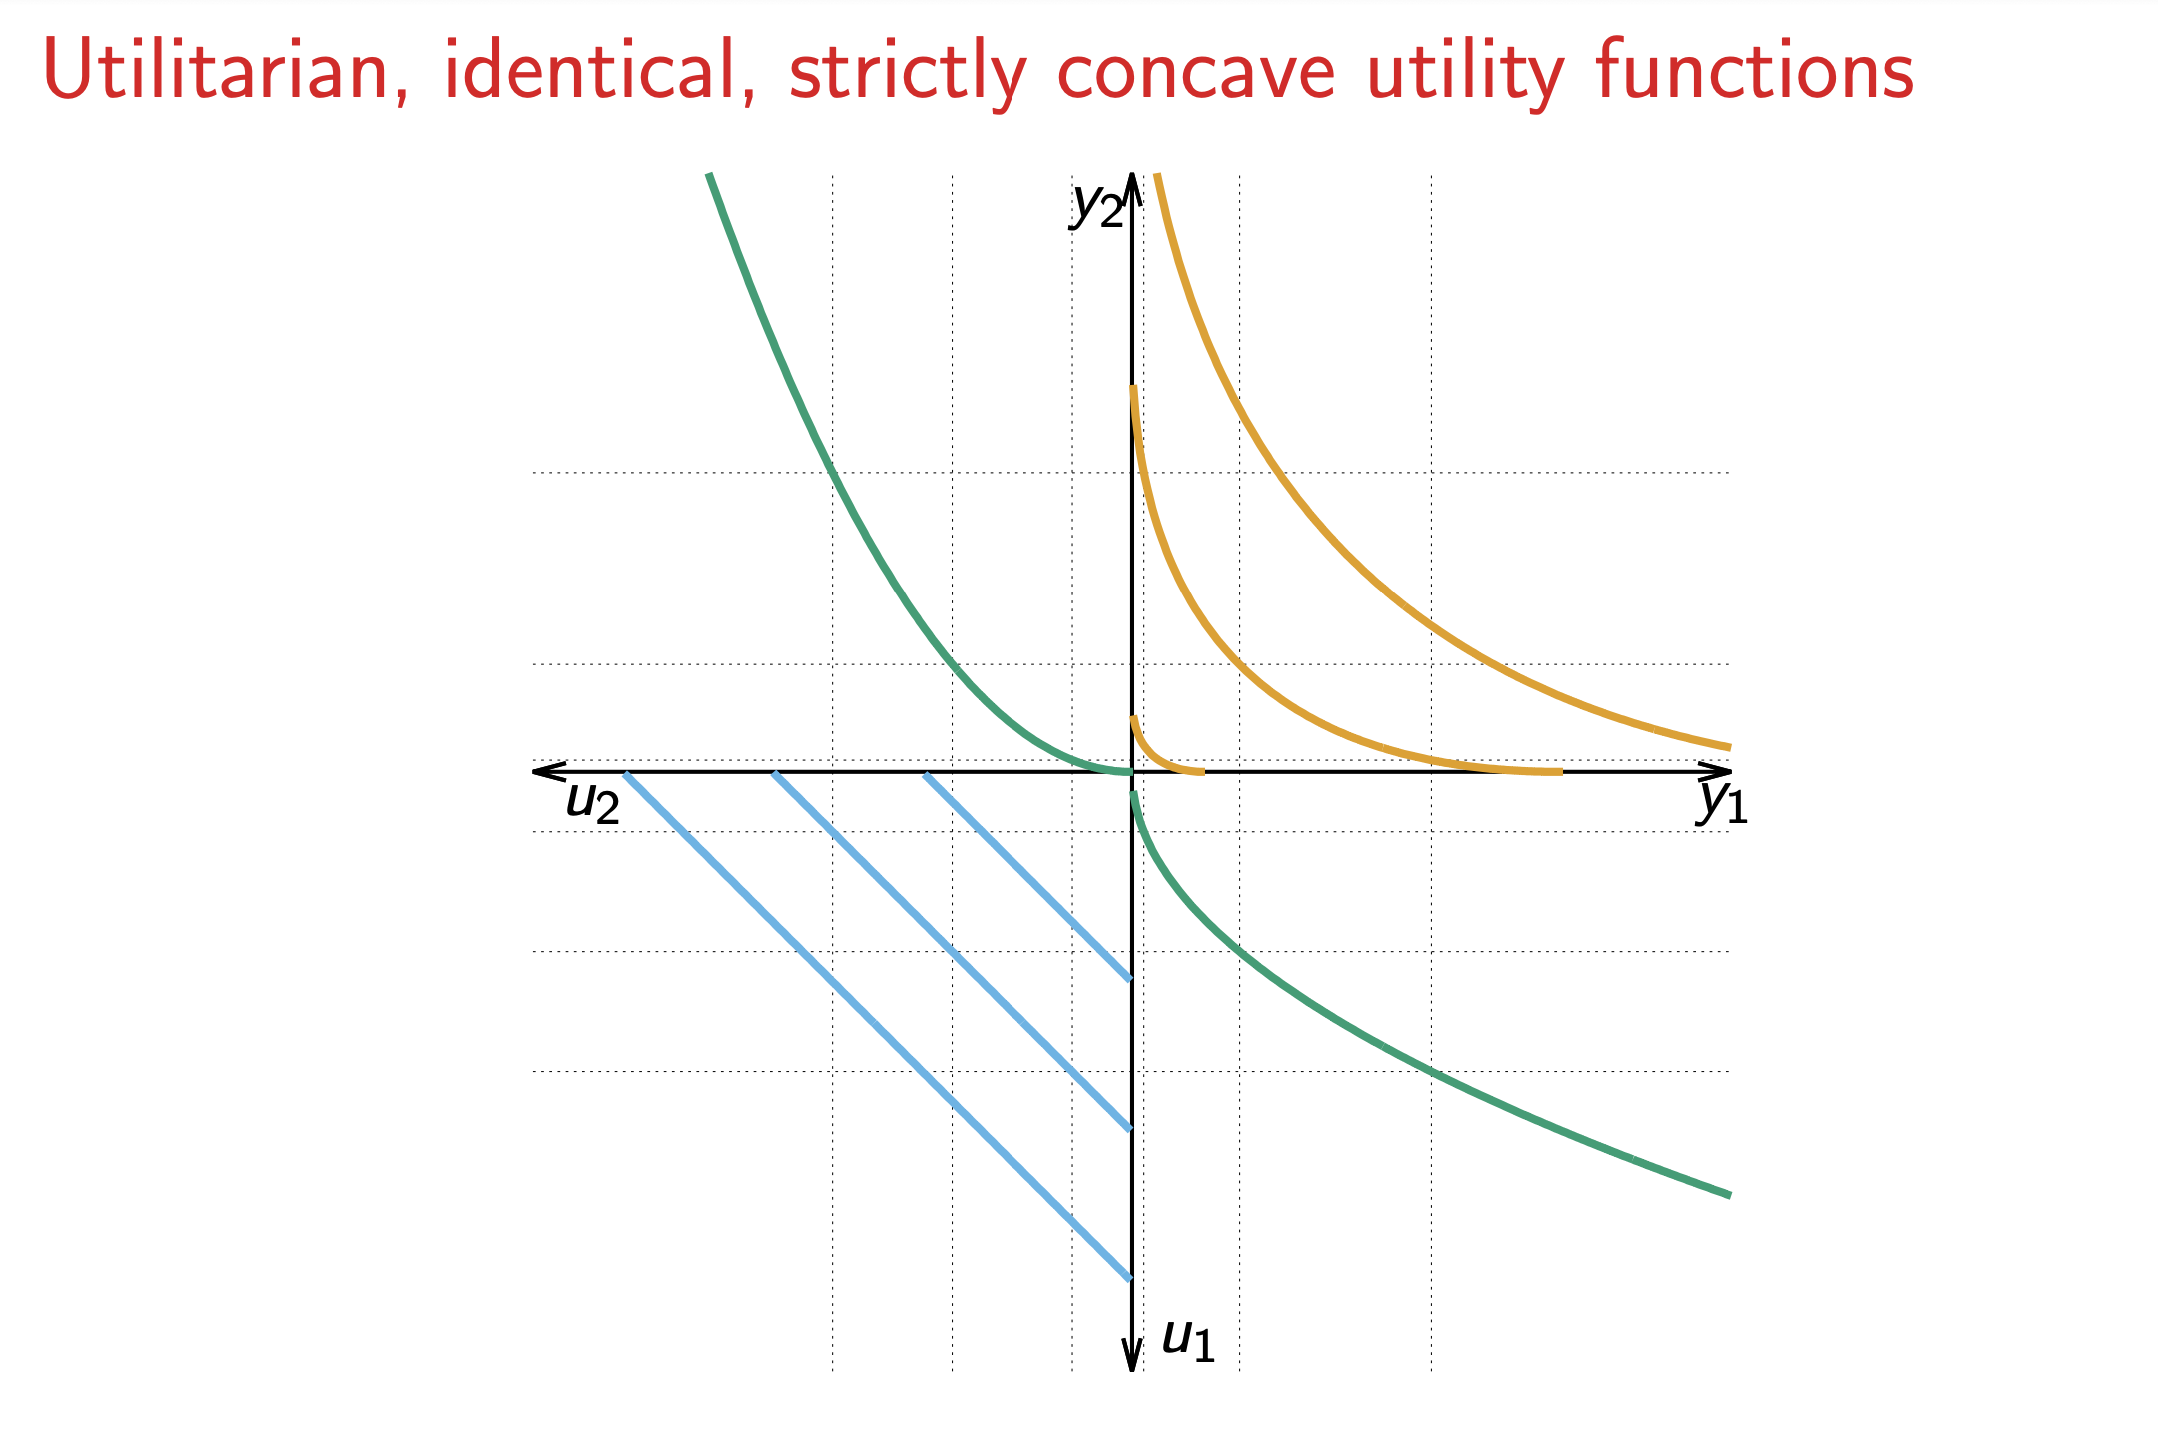
Consequentialism-Utilitarianism-Welfarism
Given the assumption that individual utilities are measurable and comparable, utilitarism sums um all the values of all the pleasures on the one oe side and those of all the pains on the other.
According to different theories, the welfare function can have different shapes but it's always increasing in all its arguments.
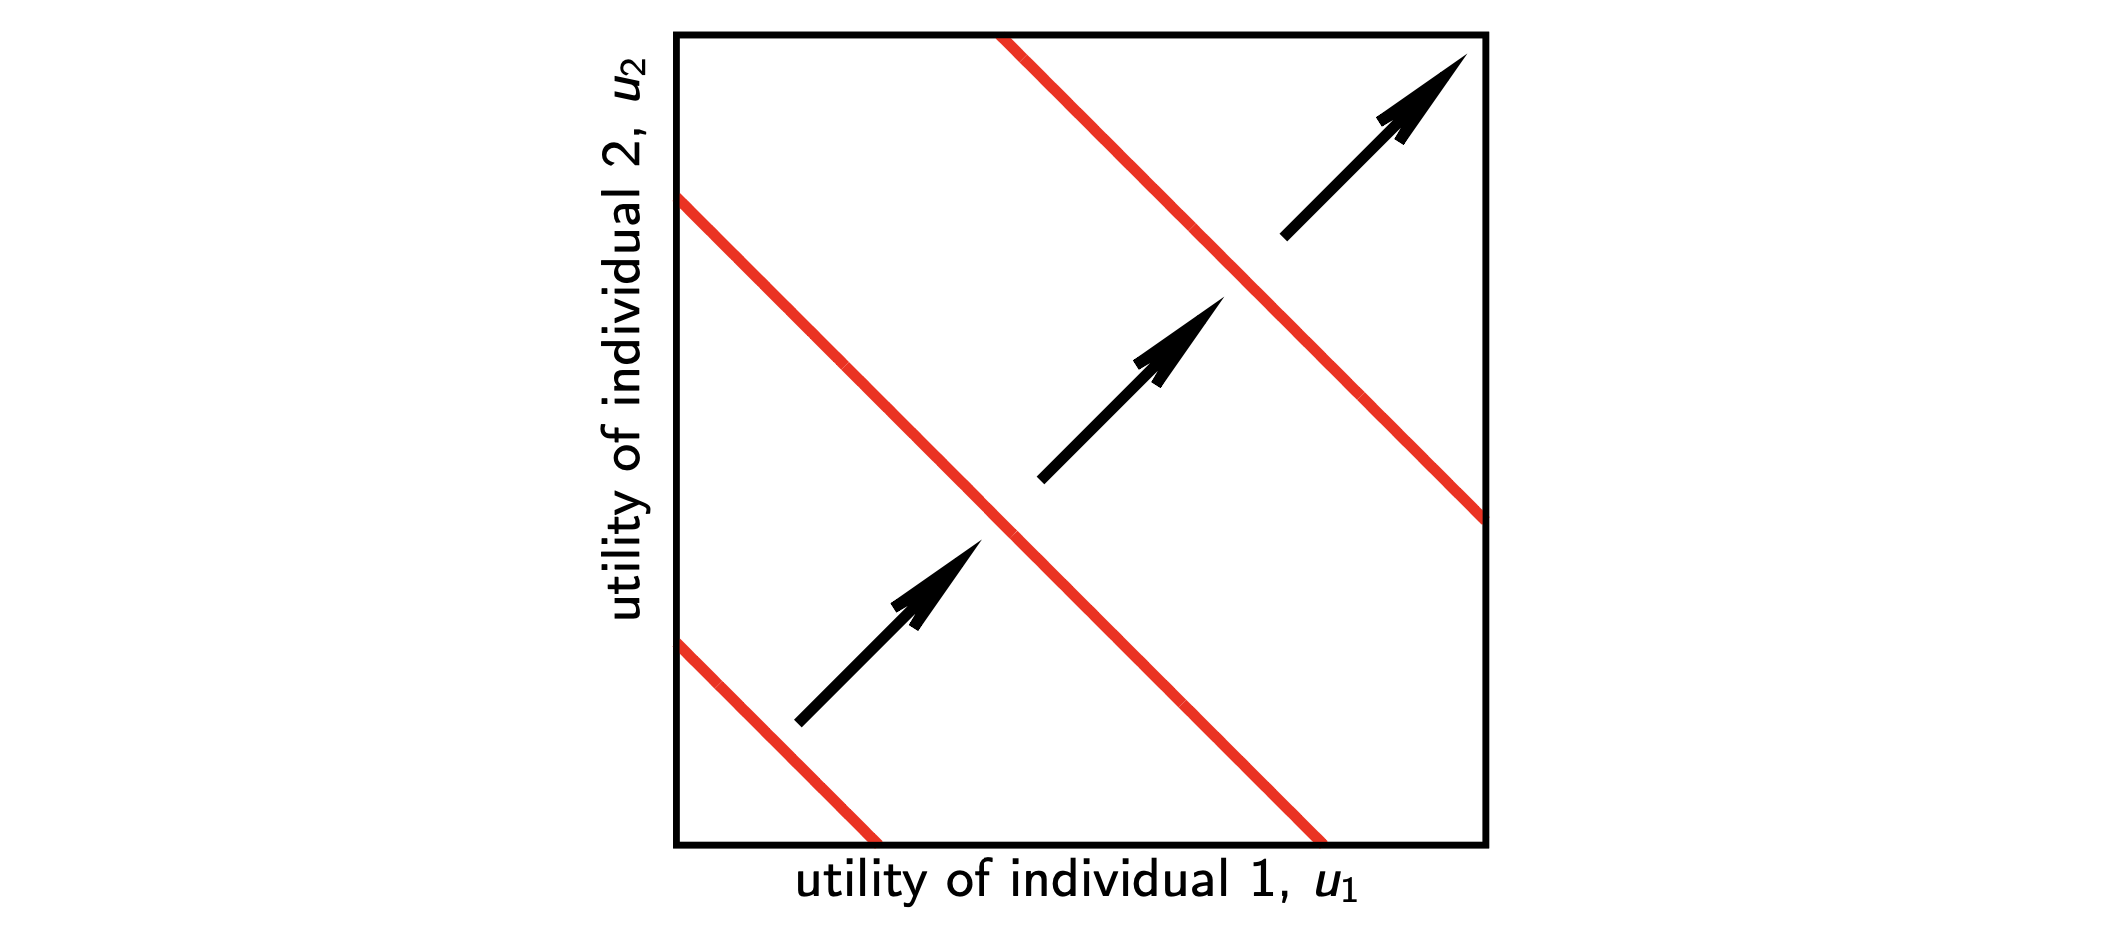
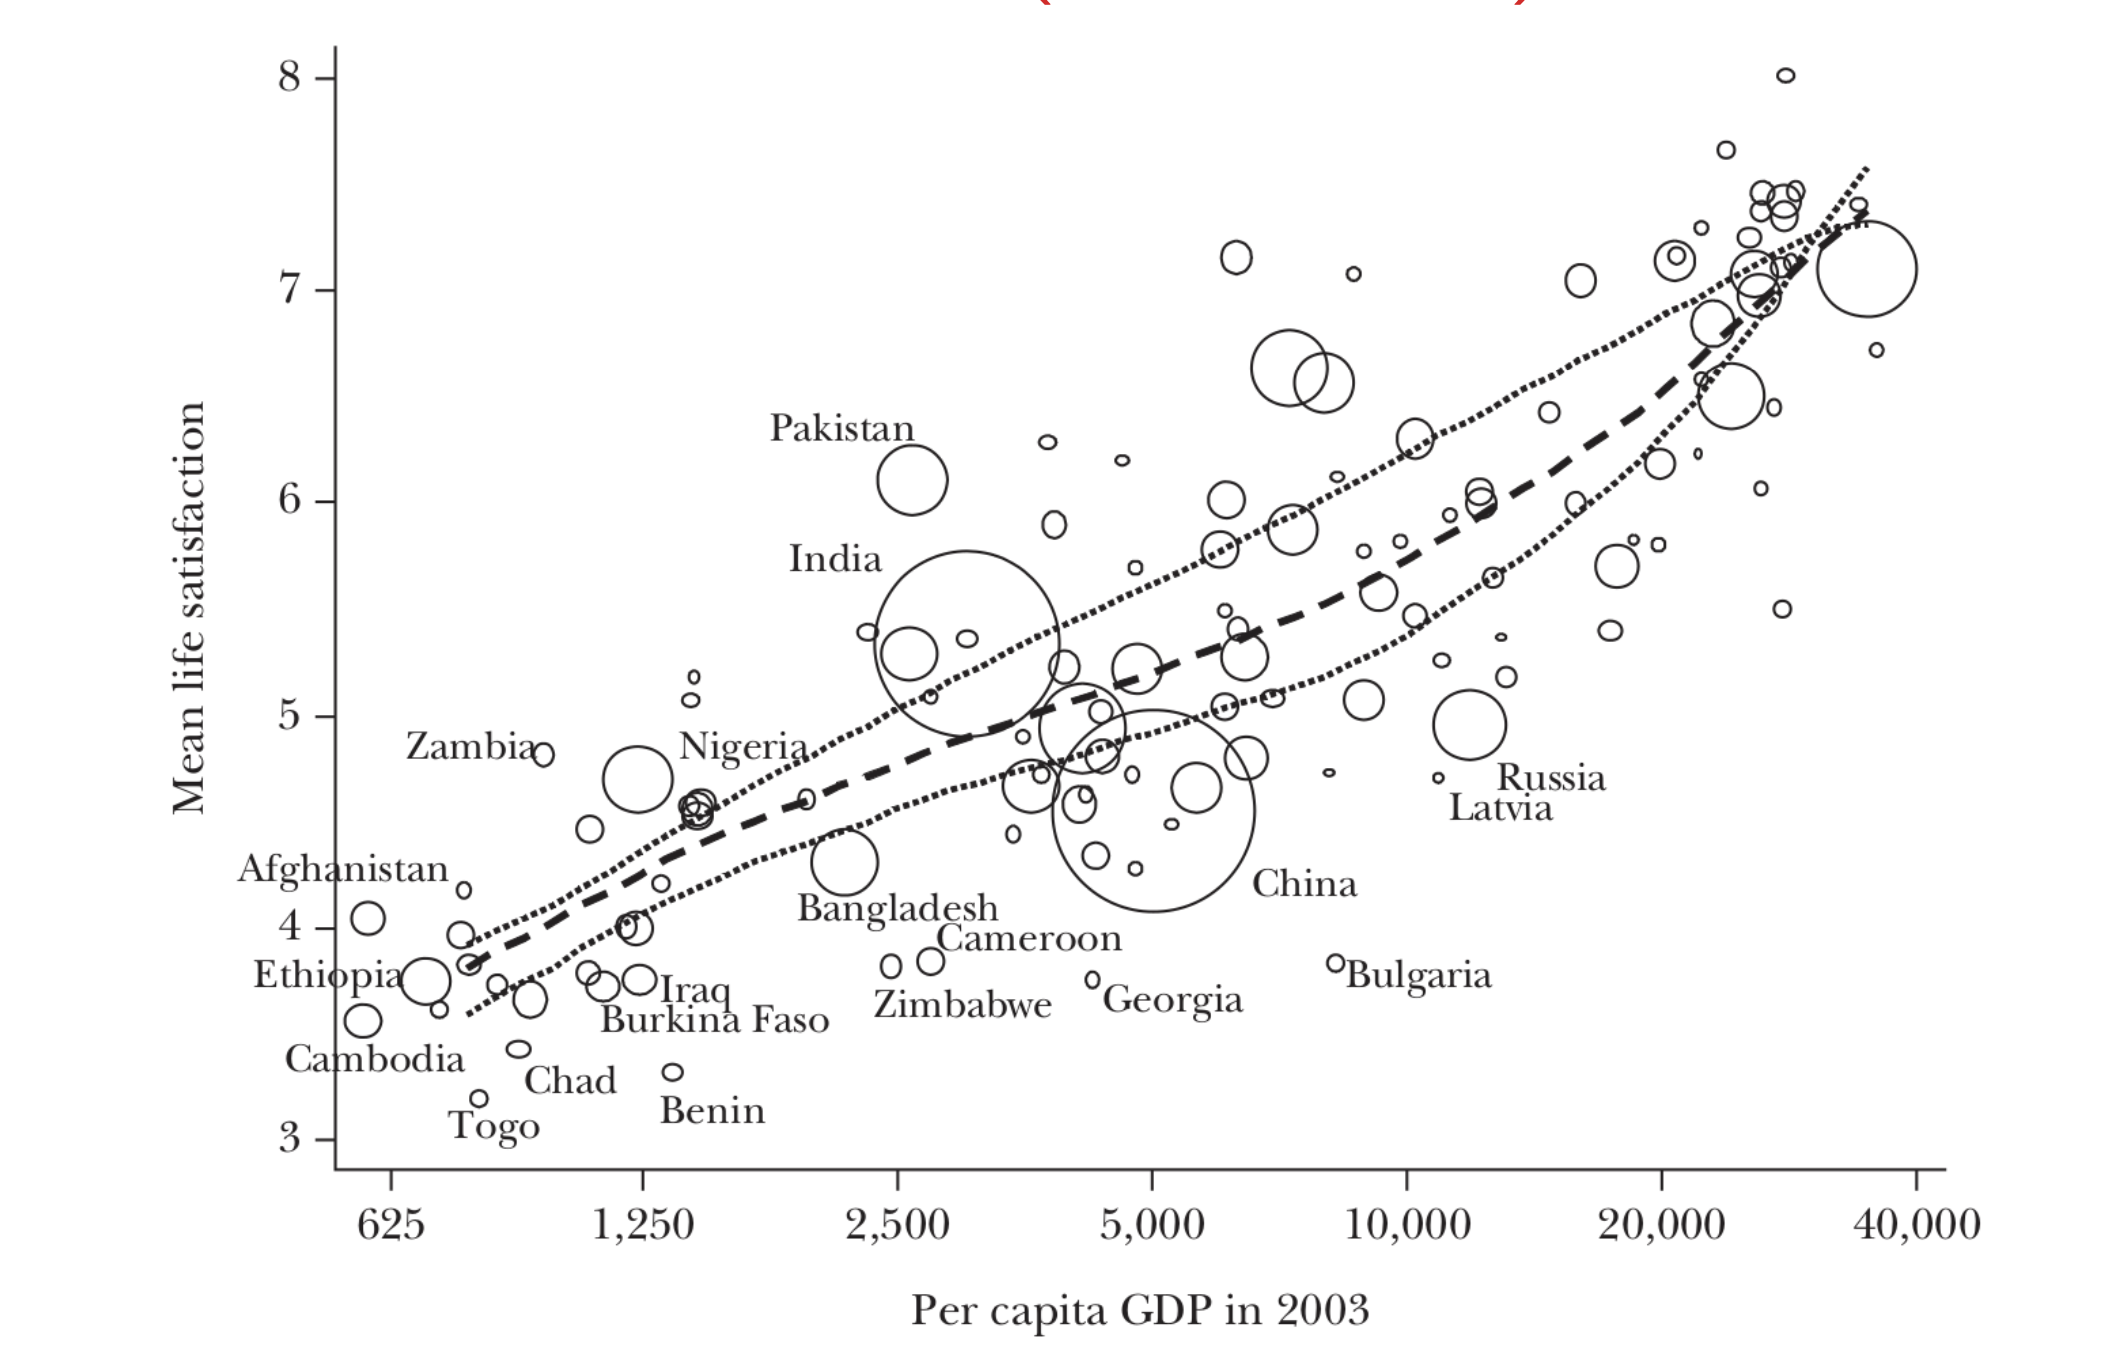
The 2015 Nobel Prize for analyzed the relationship between life satisfaction and Per Capita GDP, showing that each doubling of GDP is associated with a costant increases in satisfaction.

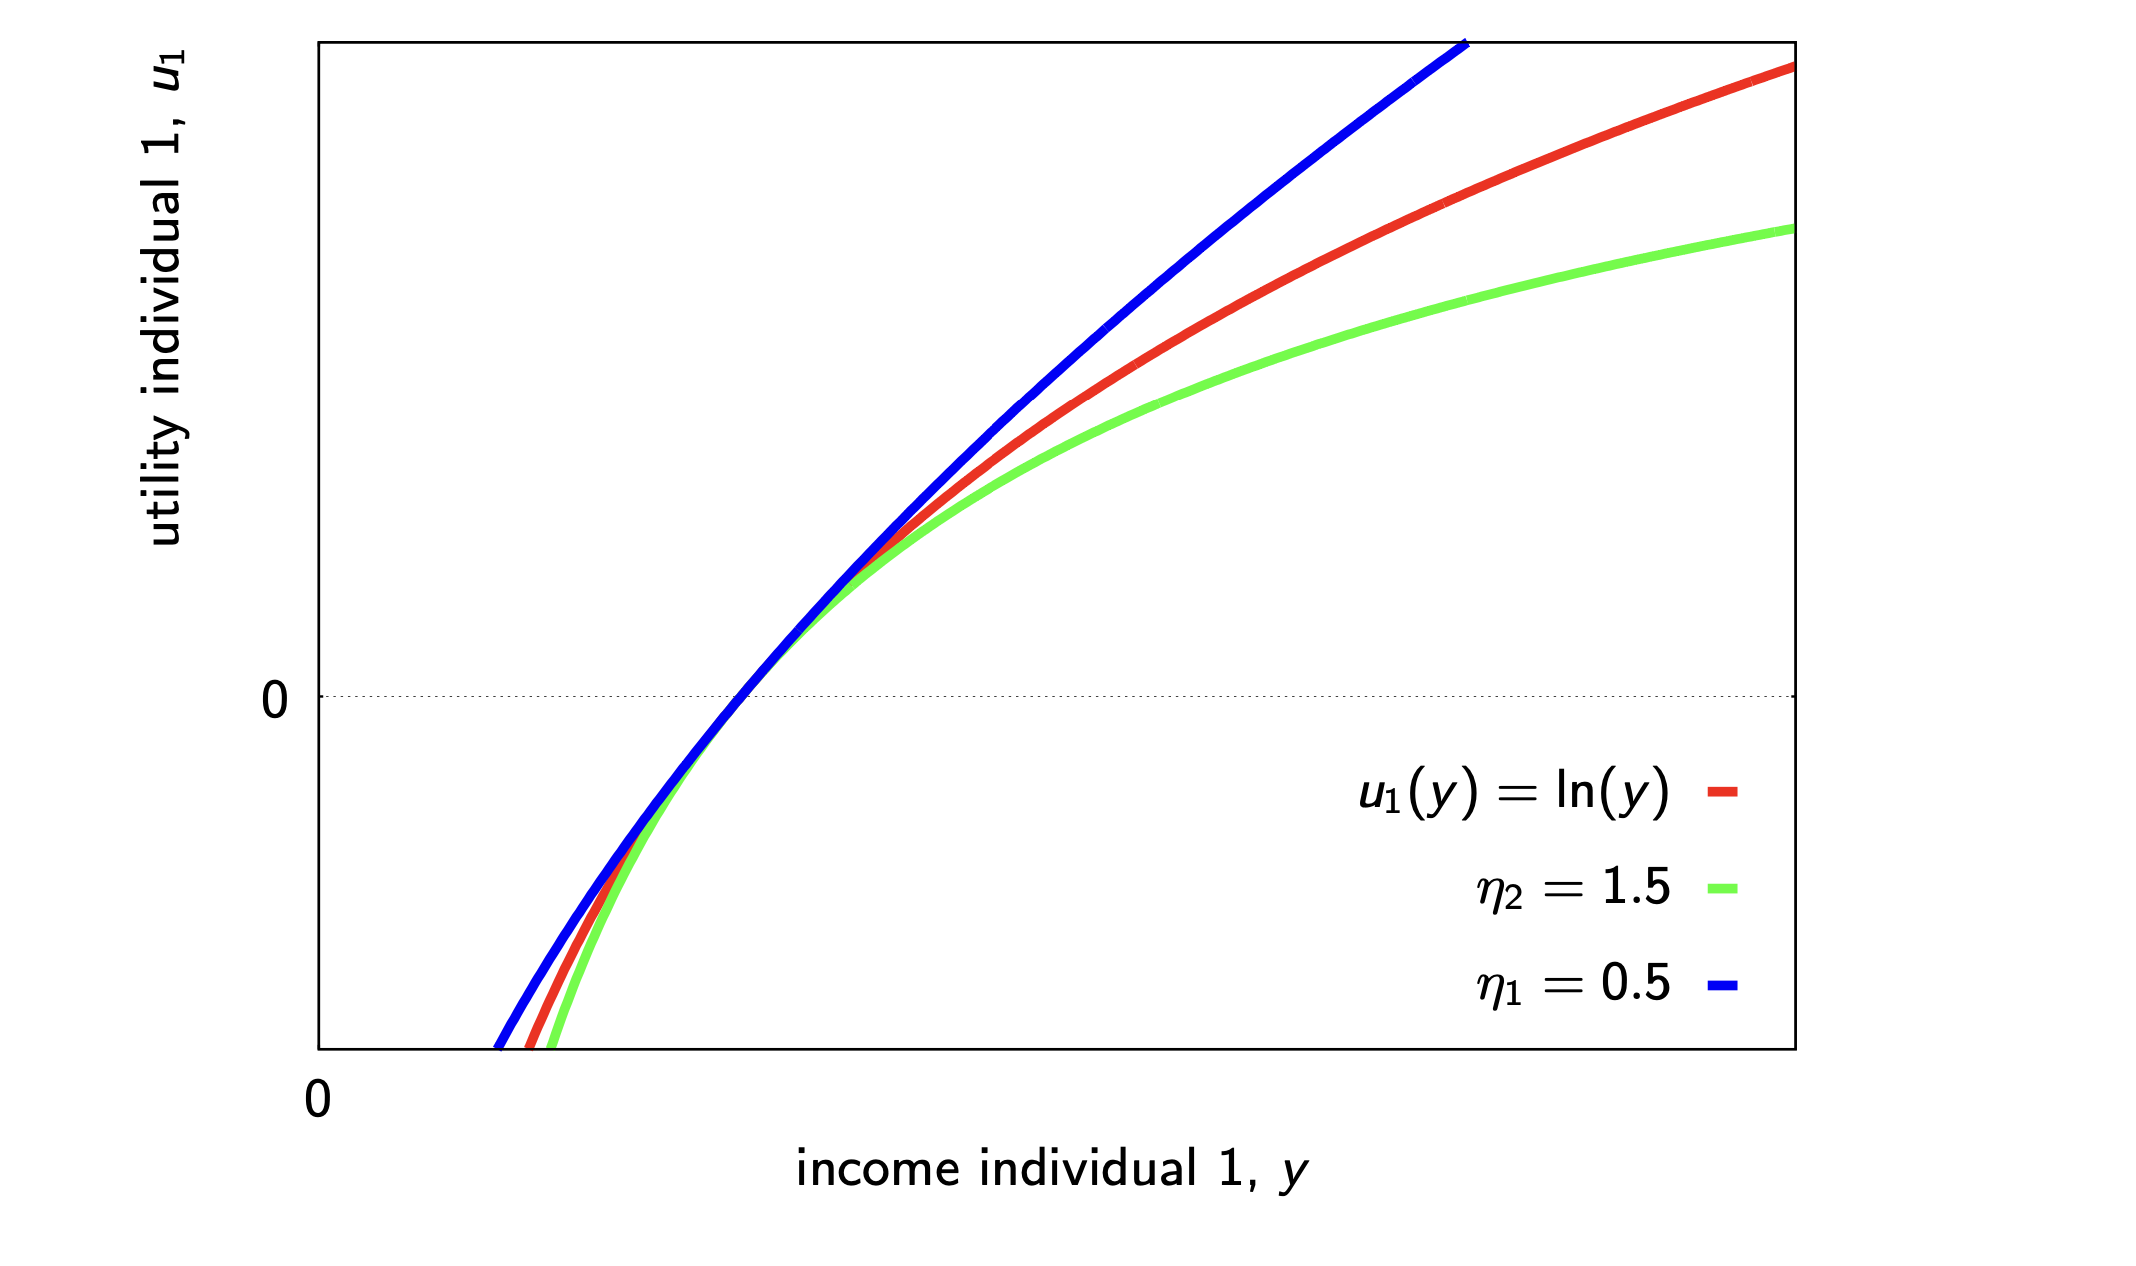
However, the relationship between income and utility is not so simple. Assuming all other aspects fixed, common findings say that utility increases with income at decreasing rate:
where determines the elasticity of marginal utility income:
Intuition: if income increases by by , marginal utility decreases by .
In the case of for in a pure distribution probel (), the maximization of the welfare function brings to:
If both individuals have identical preferences, equal incomes are welfare-optimal.
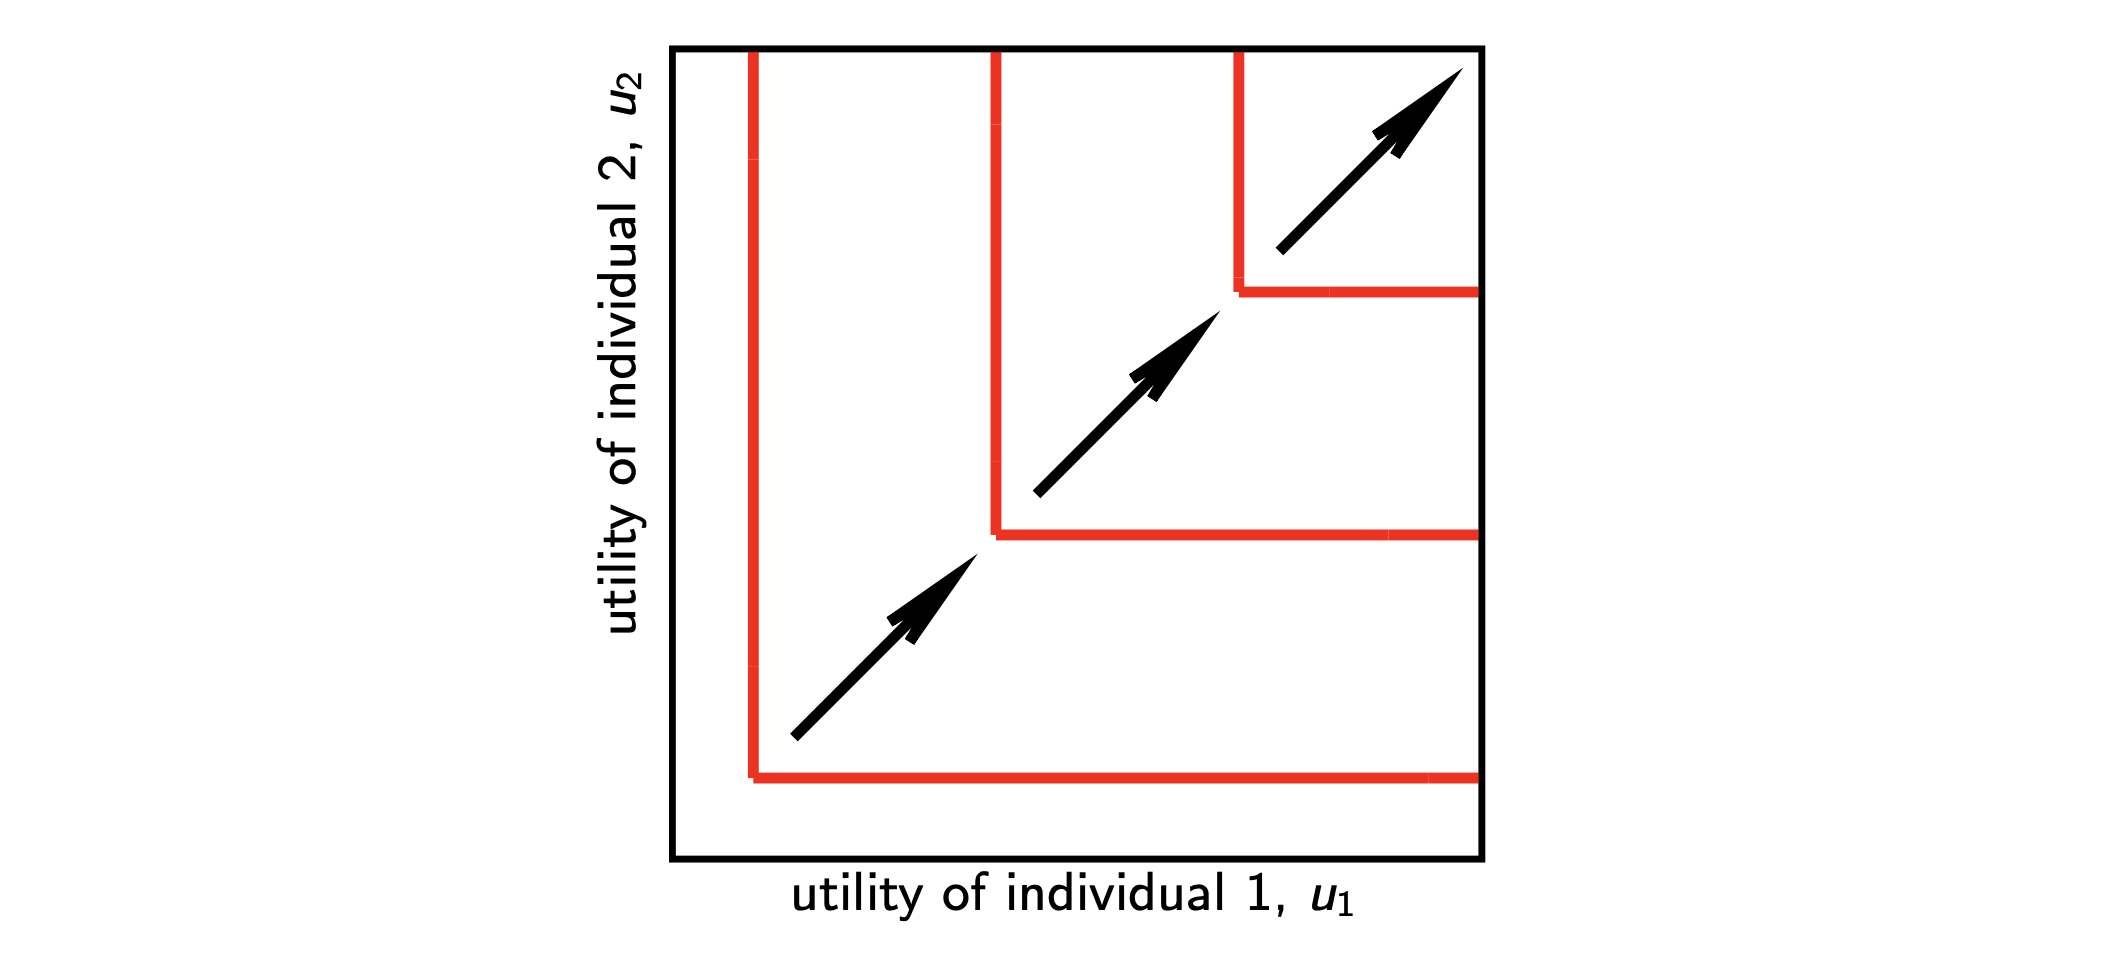
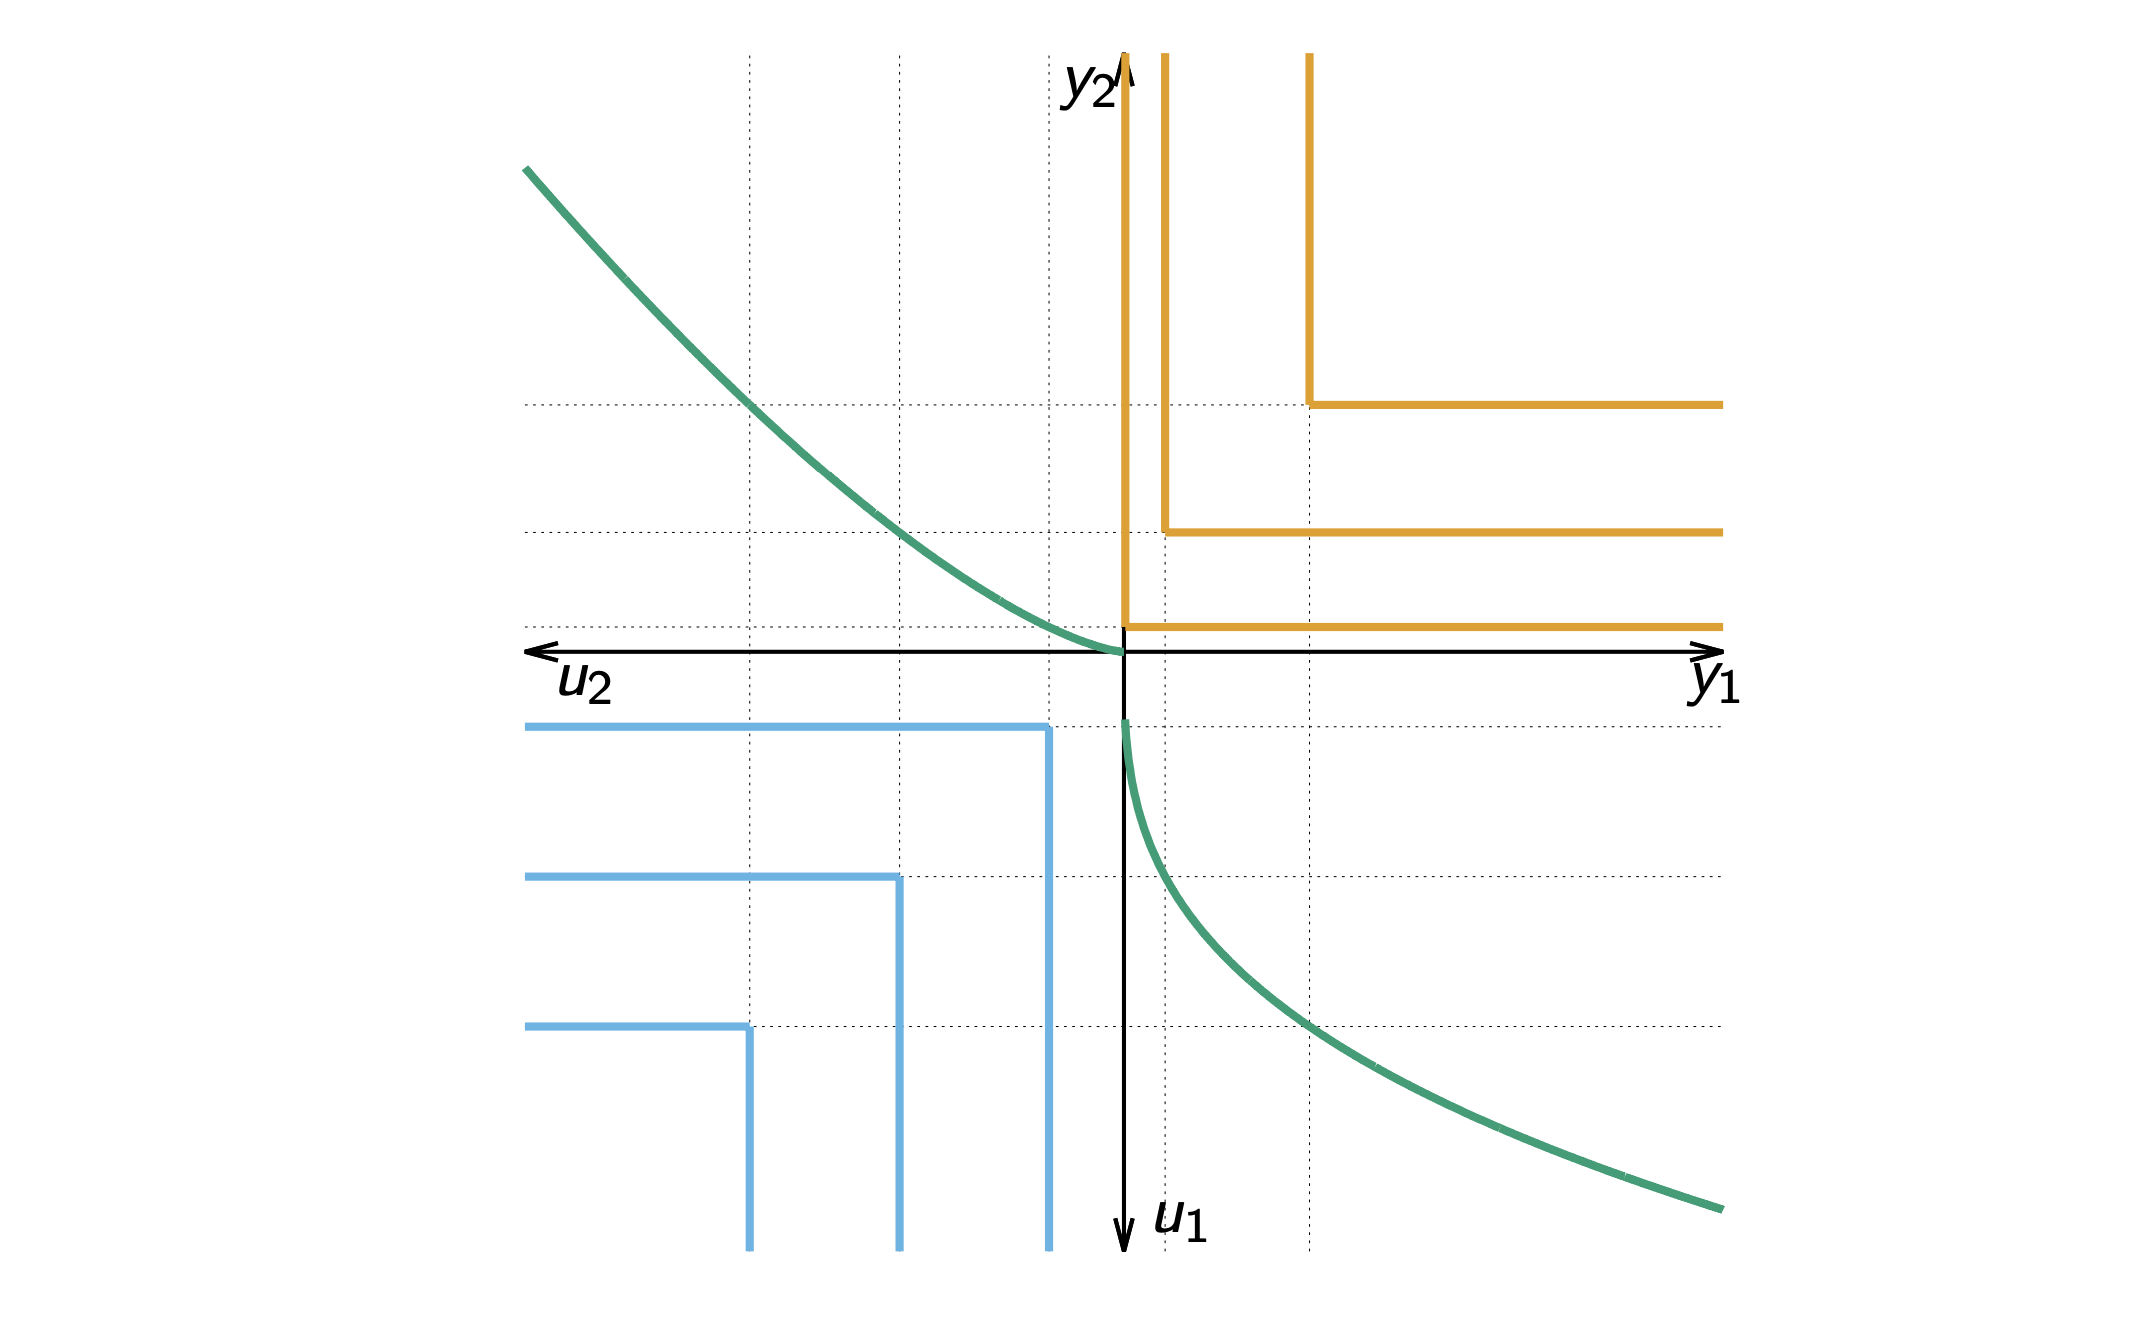
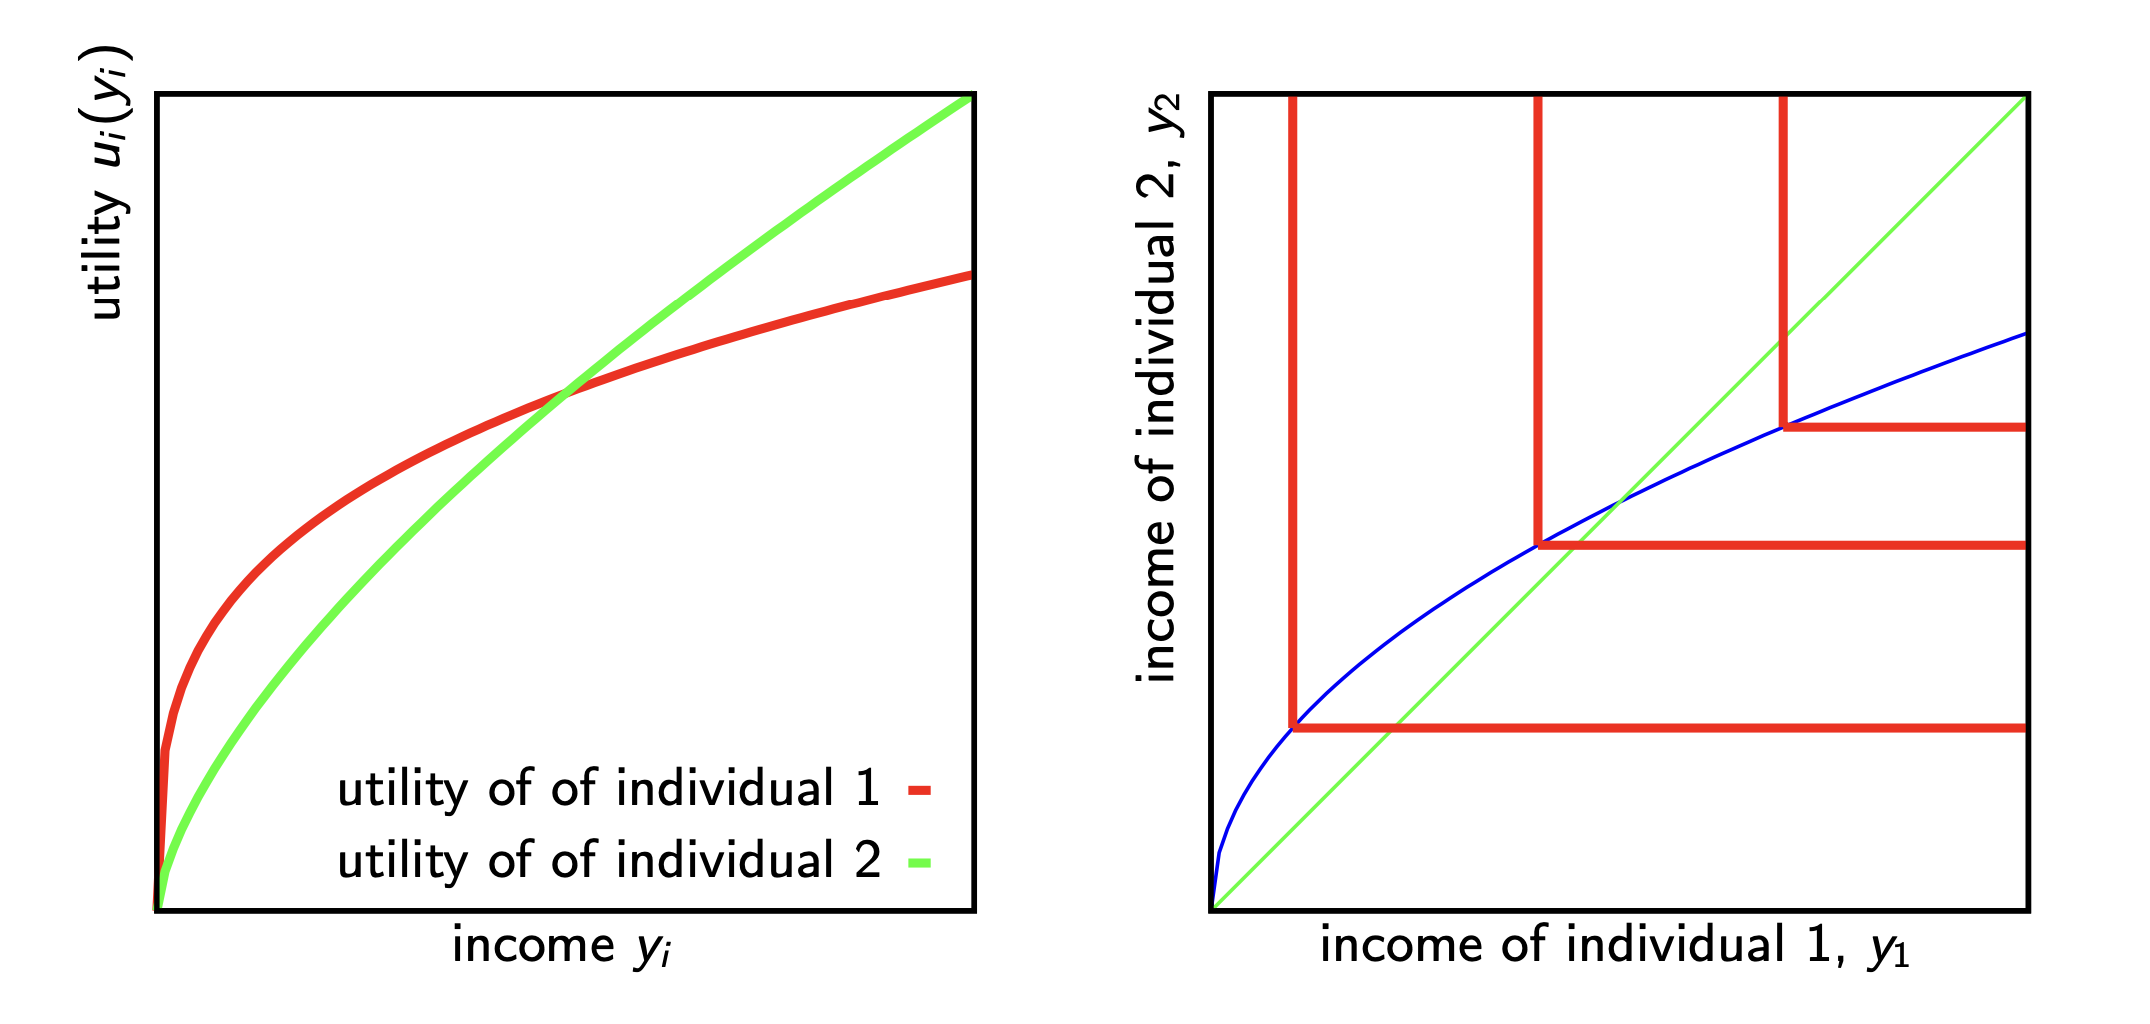
If we want to maximize the utility of the worst-off individual, that is:
that, if it feasible, to:
Note that, in this csase, maximin optimization doesn't always bring to equal incomes.
If we want to maximize the weighted sum of utilites with utility discount factor (useful in the case of 2 generations, but could also work for the intertemporal utility of a single individidual), we write:
In this scenario, consider now the utility discount factor that, for different values parameters, assumes different meanings:
-
: Impartial Consequentialism
-
Arguments :
- risk of humankind's exinction (i.e. the change of surviving in the next 100 years) brings to:
Intuition: the greater probability of surviving, the utility discount factor .
Coming back at the maximization problem, it rewrites as:
in the case of maximal distribution of a resource :
that brings to the following welfare maximizing condition:
Critiques of Welfarism
John Rawls gave the following the main key critiques:
- some people derive welfare from "offensive tastes"
- some people derive welfare from "expensive tastes"
- the conception of welfare are so diverse and cannot be measurable
In 1971, he then propose the Theory of Justice:
- each person is to have an equal right to the most extensive basic liberty compatible with a similar liberty ofr others.
- socio-economic inequalities are to be arranged so that they are (a) reasonably expeted to be everyone's advantage, (b) attached to positions open to all.
Intuition: equalization of equal liberty must be complete and is prior to the distribution of the other primary goods, then maximize the remaining three primary social goods starting to the lwast well-off.
In contrast, Amartya Sen argued that Rawls went too far in the opposite direction of welfarism since primary goods are not the right maximanda. Instead, the focus should be on what goods to for people (capability approach).
In this debate, if the various institutional primary goods were equally supplied:
- Rawls would call for equalizing the remaining one (income)
- Sen would call for distributing income in order to equalize the functionoing that people can achieve with that income.
- Sen defined a person's capacility as the set of vectors of functionings available to him he suggests not to equalize the indec of functionings, but rather for equalizing the capabilities across all people.
- Also, since there are multiple measures of humand advantage and capability, Sen claims there's no single recipes for justice and proposes and ideal theory of justice to reduce clear inequalities.
9. Principles of Benefit-Cost Analysis in the Climate Context
A cost-benefit analysis is based on the idea of potential Pareto improvements and the Kaldor-Hicks-Scitovsky compensation criterion.
In this context, a reallocation is desirable if:
- the winner could compensate the losers and still be better off
- the losers could not compensate the winners for the reallocation not occuring and still be as well off as they would have been if it did not occur.
Note that, in realty, these compensation rarely take place and don't necessarily balance out across different projects!.
CBA in Integraded Assessment Models (DICE)In simple BCA terms, we want to balance avoided climate damages with mitigation costs, defined as:
- : fraction of economic output that is required to reduce emissions to zero.
- : emission control rate.
- : cost convexity parameters
Furthermore, we model the damage function as:
- : aggregate scaling parameter for the damages on consumption via production-damages.
_Note that there's a quadratic Scaling: in the DICE model, damages scale quadratically with (change in atmospheric temperature compared to pre-industrial levels).
As we seen before, the welfare function is then calculate as:
- : population size in period .
- : rate of pure time preference, it reflects how much less we value the utility of future generations compared to the present.
- : the (minus) elasticity of the marginal utility of comprehensive consumption, it represents society's desire for consumption smoothing or inequality aversion.
- : index of generalized (per capita) consumption.
Following the DICE model, we can end up with the following estimation:
| social cost of CO2 | world | Switzerland | |
|---|---|---|---|
| CO2-eq. emissions 2020 | 36 bill. tonnes | 43 mill. t | |
| Nordhaus | ≈ 36 USD / t CO2 | 1285 bill. USD | 1.5 bill. CHF |
| Stern | ≈ 300 USD / t CO2 | 10,786 bill. USD | 12.9 bill. CHF |
- Swiss contribition to global climate costs amounts between 2% (Nordhais) and 17% (Stern) of the 2020 Swiss GDP.
- The difference between the estimates is due to the different discounting terms. choosing yher right long-term discount rate for CBA is one of the most critical problems in economics.
10. Extensions of Benefit-Cost Analysis: Distributional Weights, Limited Substitutability, and Uncertainty
The Social Discount Rate (SDR) for the long-run: THe Simple Ramsey Rule
- is the expected average risk-free market interest rate
- is the rate of pure time preference
- is the expected per-capital real growth rate of consumption
- is the elasticity of marginal utility of consumption (inequality aversion). Intuition: it represents to what degree should the relatively poorer present invest to support the relatively weπalthier future.
Nordhaus's view and DICE-2016 climate policy path
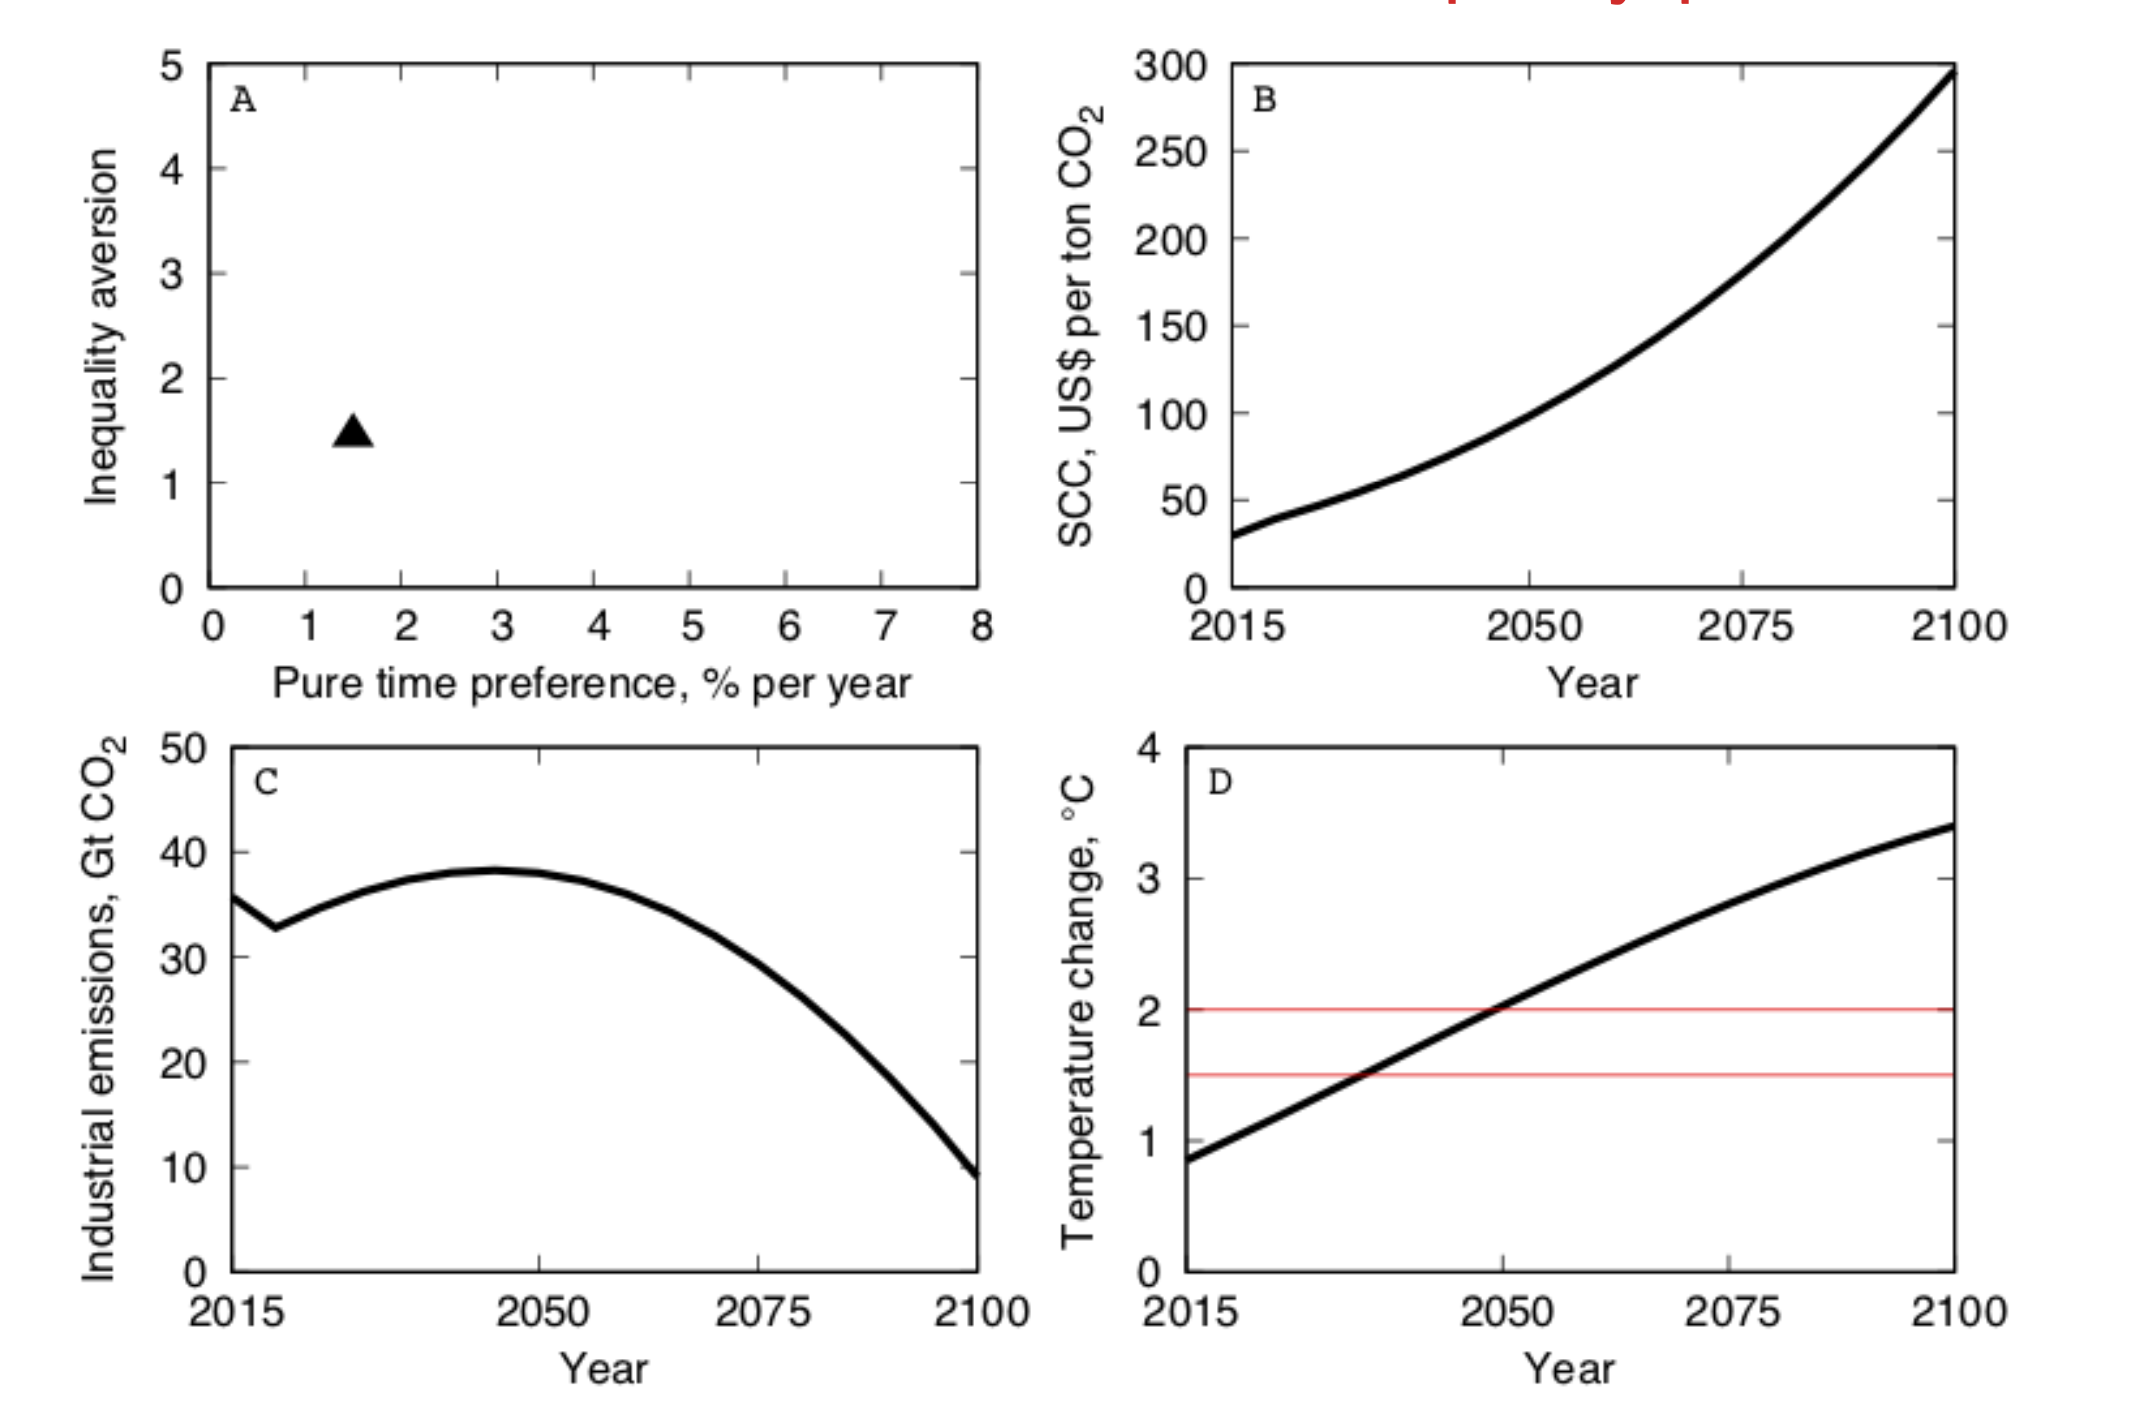
- These conclusions are of course sensitive to the parameters that determine the social discount rate.
- By academic community, these estimated are "reasonable" and lie the plausible range of views on these parameters.
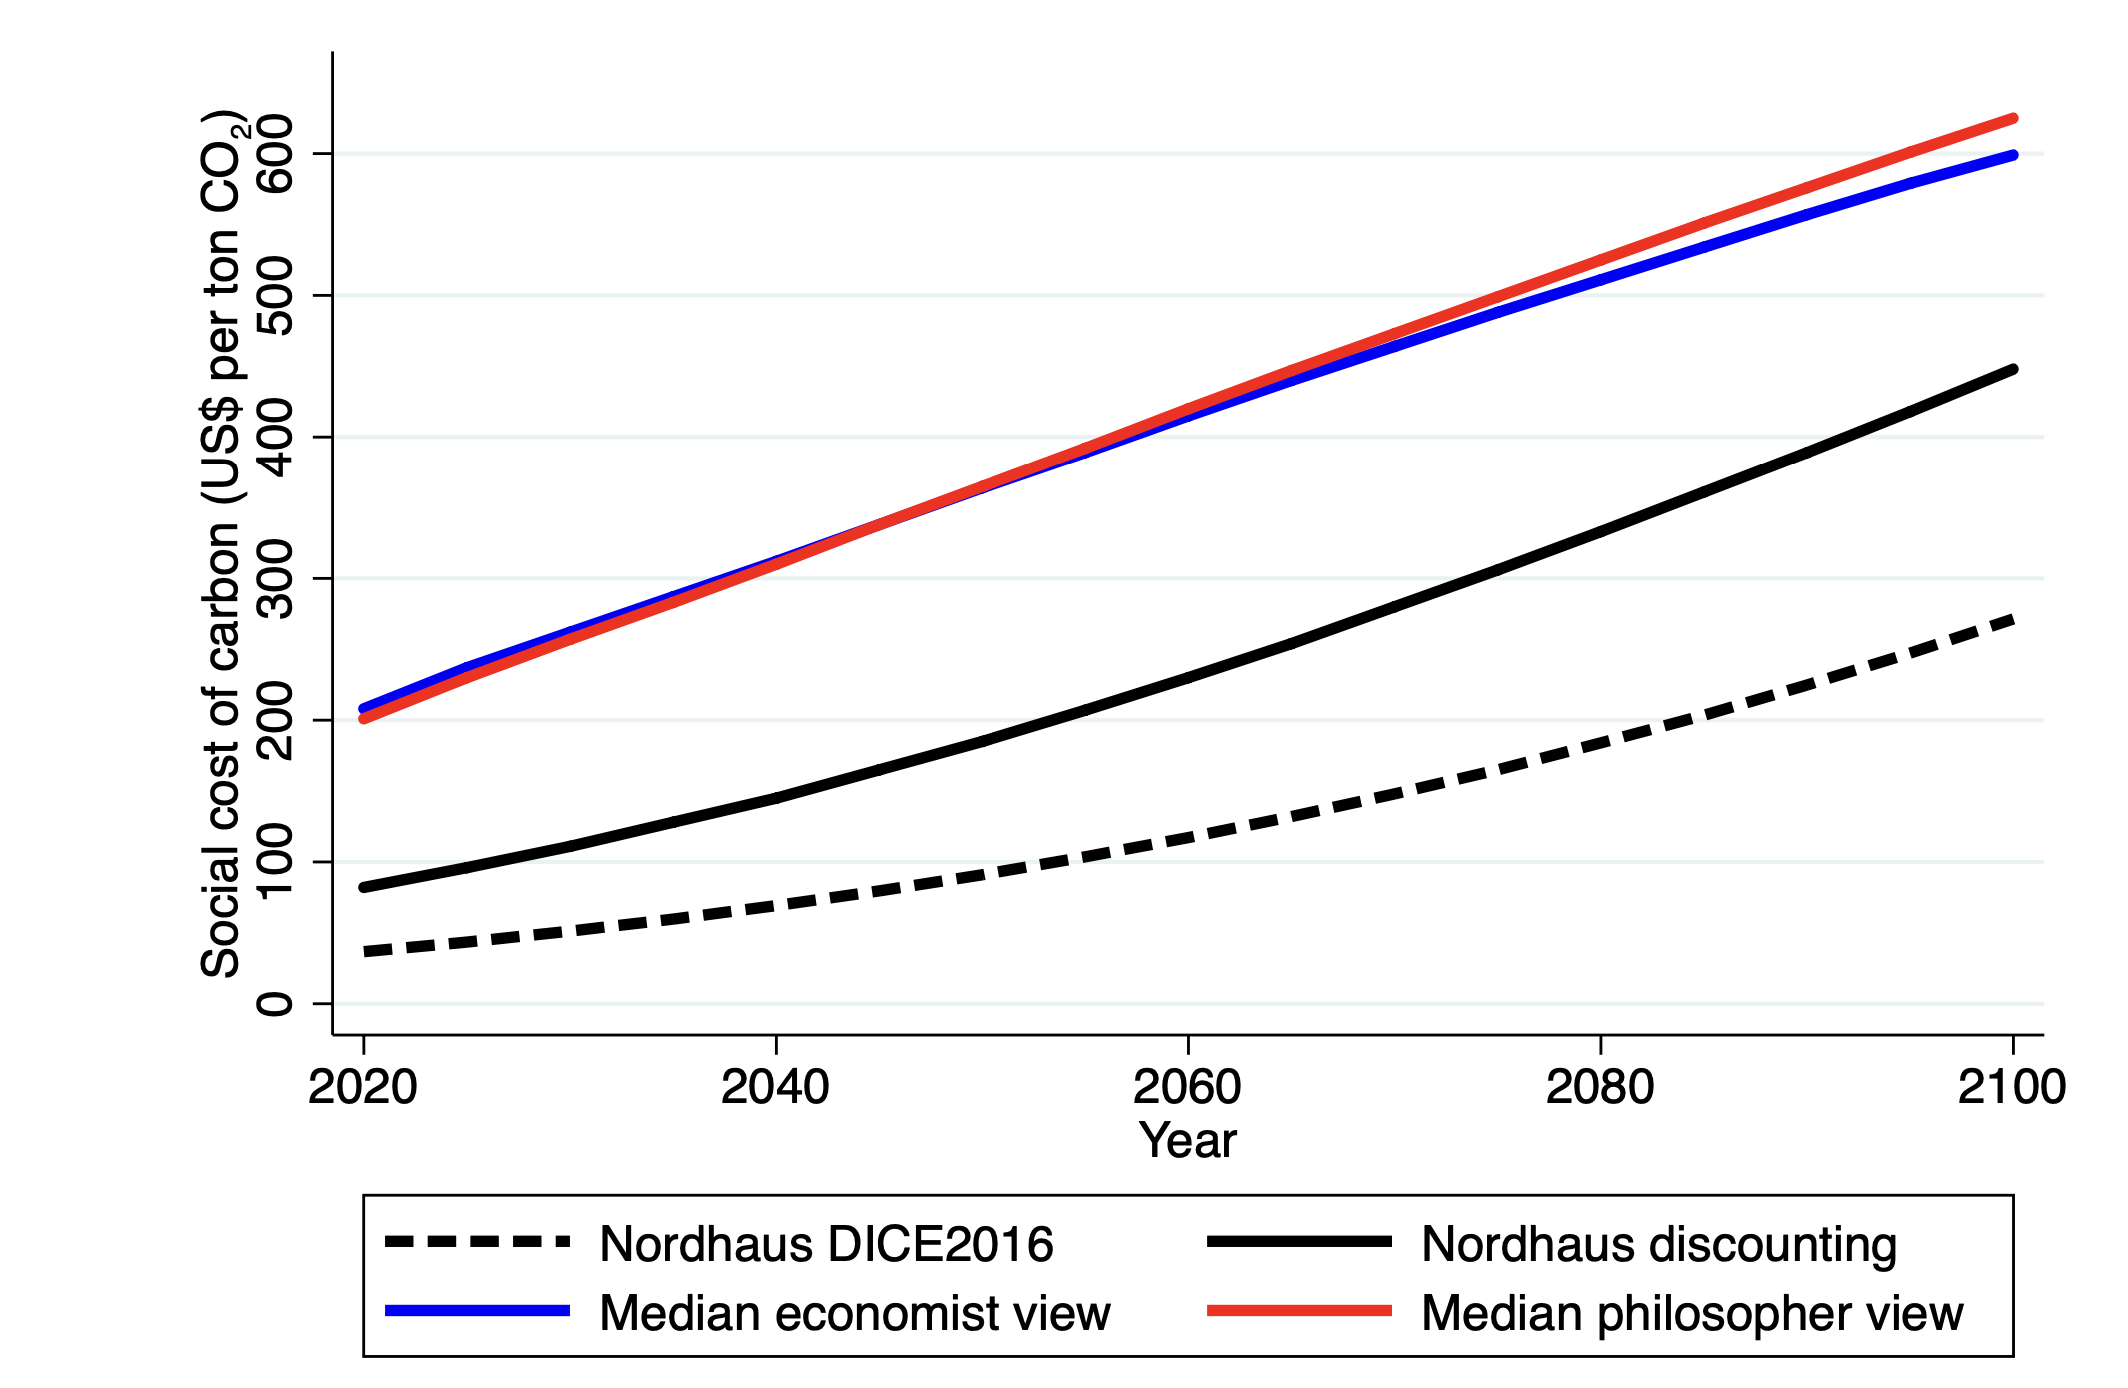
Generally speaking, depending on the view on , the DICE model can return very different results.
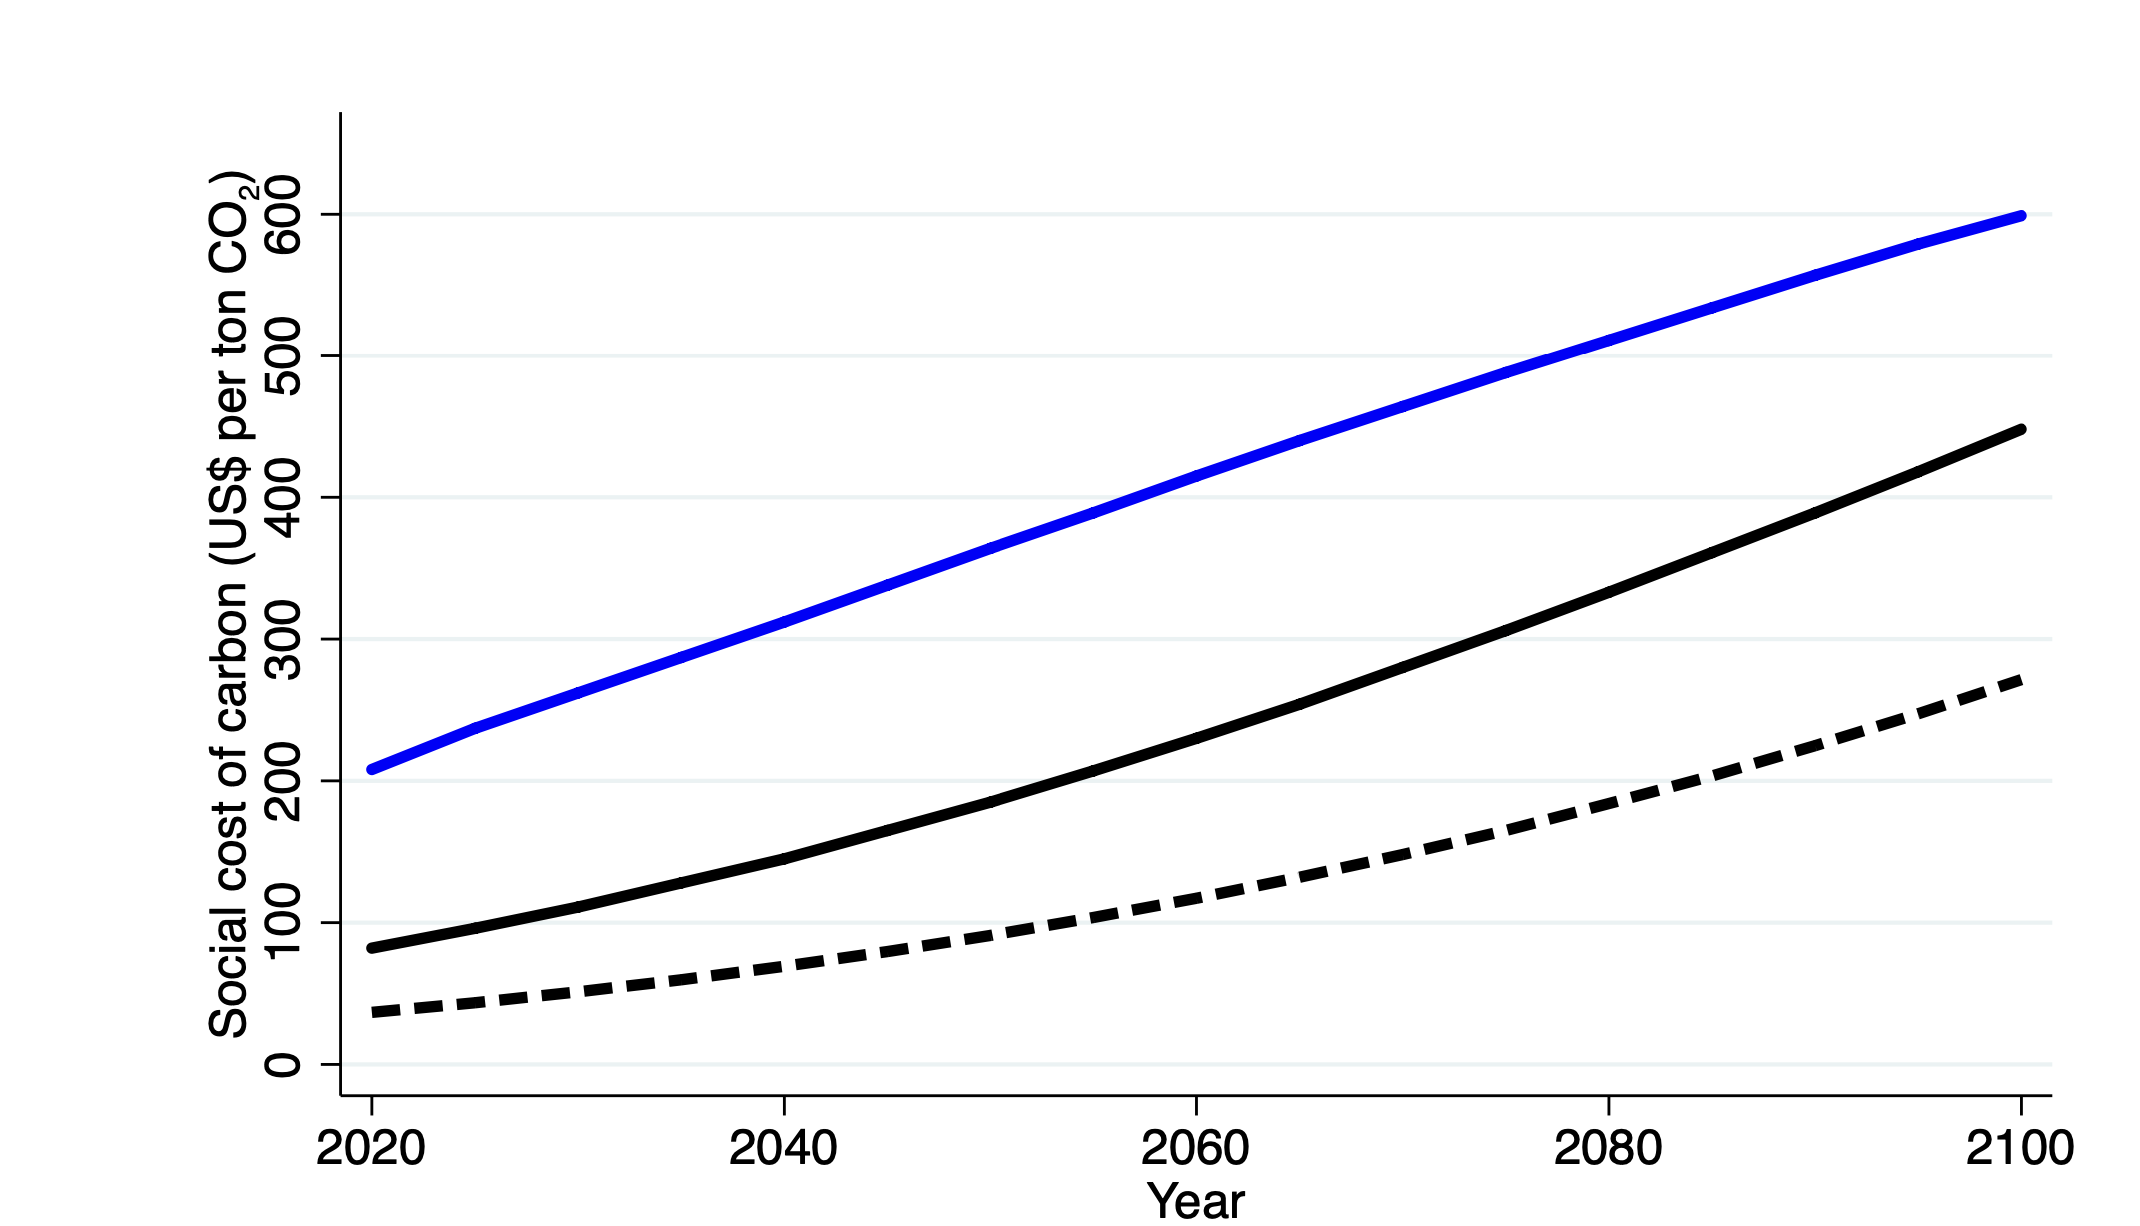
Howevers, these choices were historically done just by economists and it is unclear if they posses any special ethical expertise Neet for a broader input.
In this scenario, philosophers give responses on discount parameters, resulting in:
- lower median pure time preference higher SSC
- higher median inequality aversion lower SSC
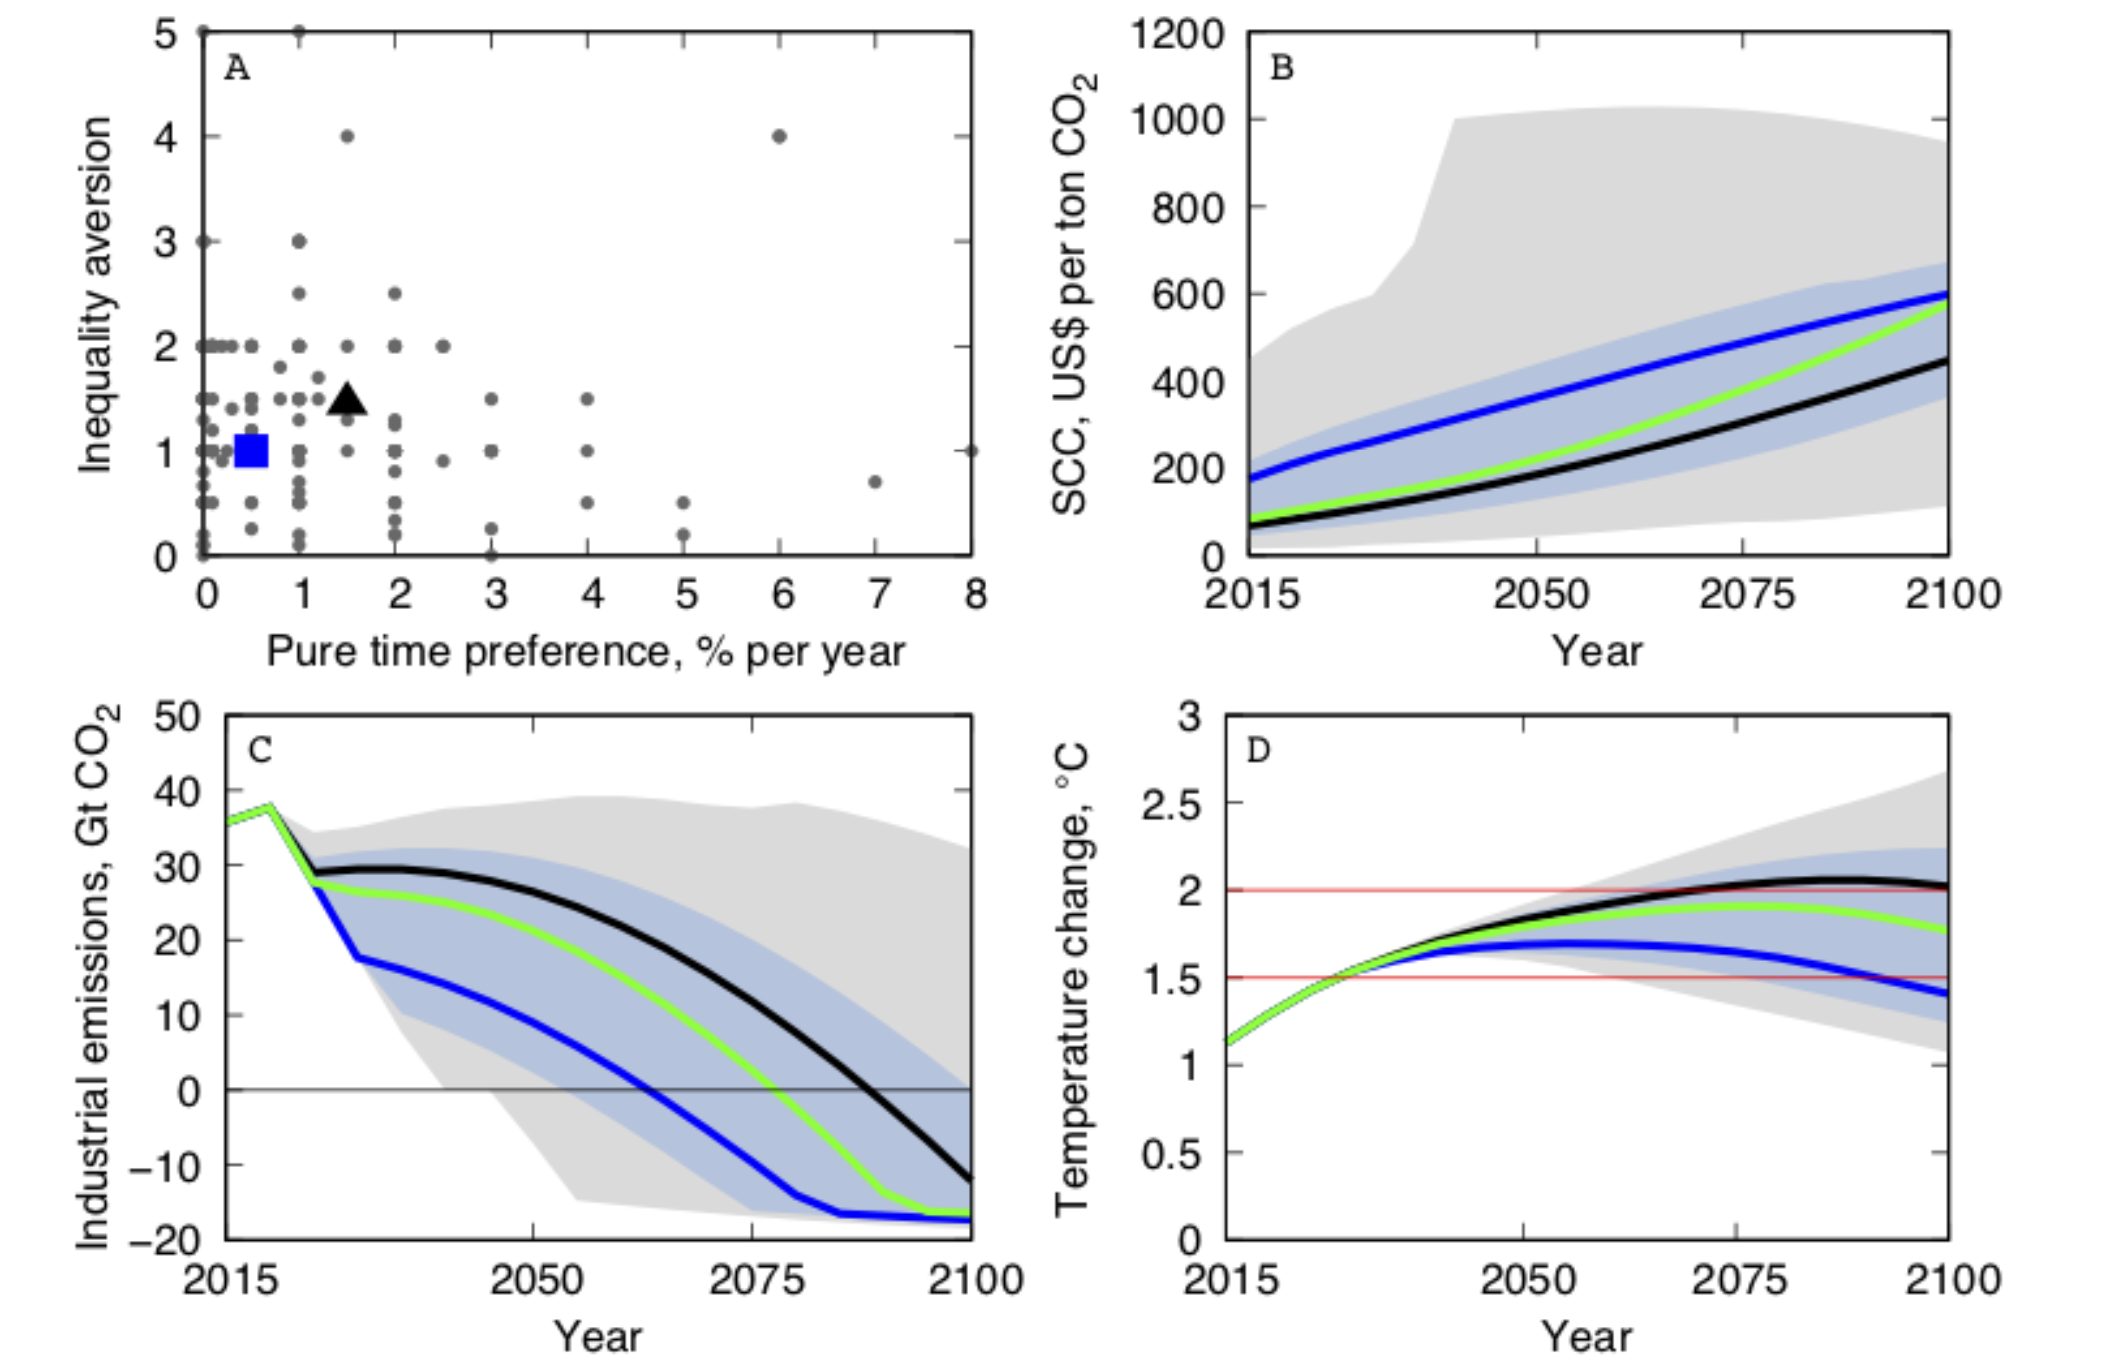
However, experts do NOT use the Simple Ramsey Rule.
- for 81% of expeters this rules doesn't hold
- the SDR is, on average, 1.2 % points lower than the imputed one from the Simple Ramsey Rule ( expets give much more importance to the long-term future than simple theory suggest)
In particular, this rule doesn't work for the following reasons:
- limited sustainability of non-market goods
- intragenerational inequality
- risk and uncertainties ignored in the model
- alternative ethical approaches
Extensions of the model: qualitative quotes from Drupp et al. (2018)
Because the discount rate is dependent on future scarcities [...] etc. there should be no single discount rate across the board. Natural assets, monetary investments, infrastructure projects etc. should be discounted at different rates.
“If future costs/benefits accrue e.g. to environmental amenities, I would argue for a very low discount rate, based on an expectation of increasing relative prices for these goods.”
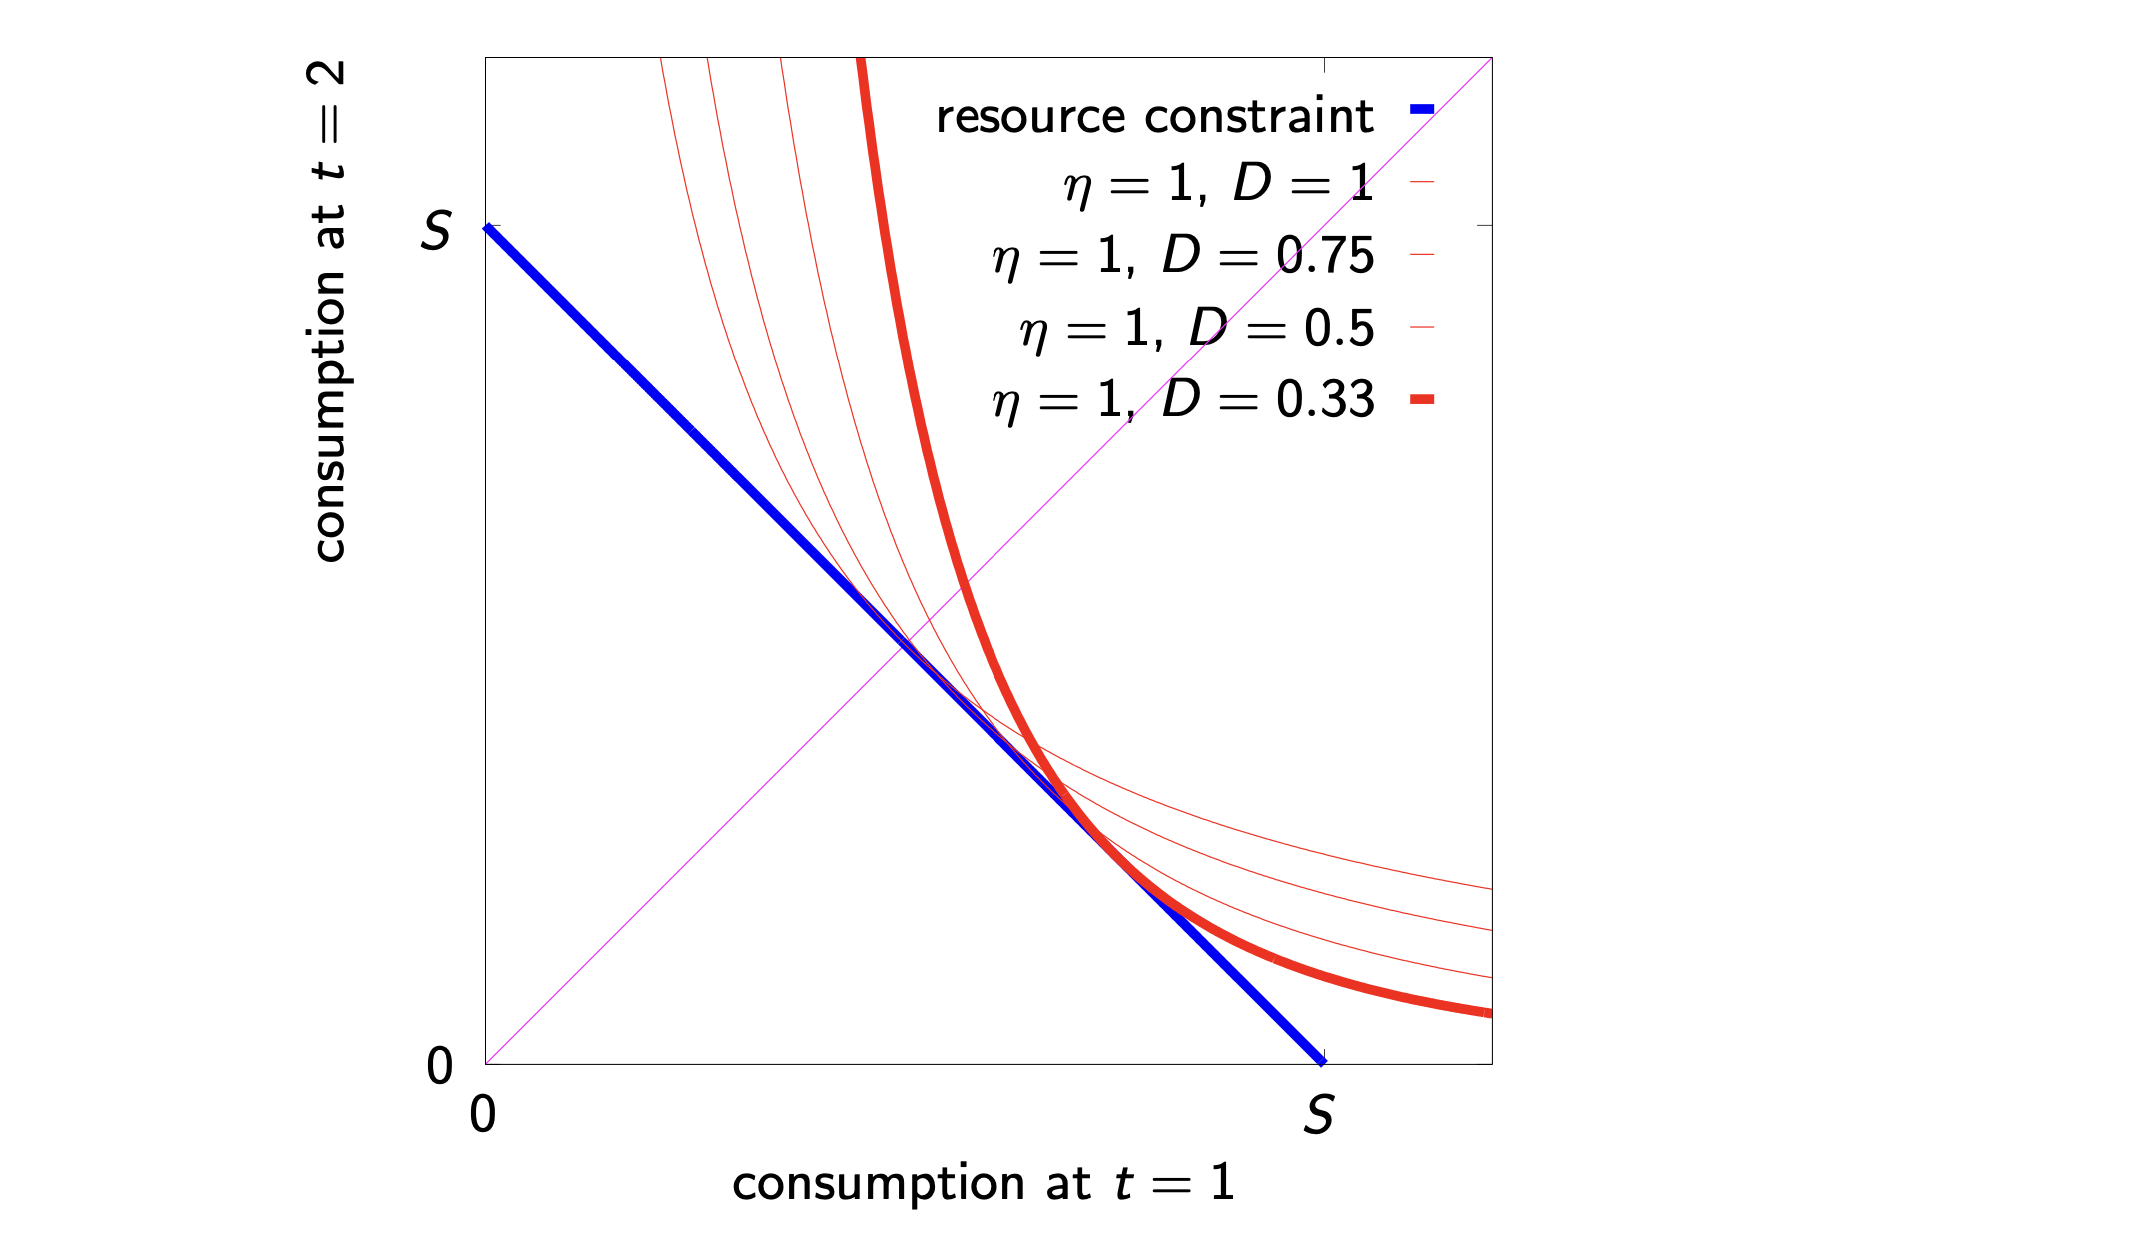
Extension (1); Discounting enviromental goodsCOnsider a standard discounted Utilitarian social welfare function where ecosystem services are a direct source of utility . In this scenario, the social welfare function can be defined as:
We can proceed in two mays.
Firstly, we can consider two different discount rates, one for consumption one for ecosystem services:
Secondly, we can account for relative (shadow) price changes_ (RPC) of ecosystem servies relative to human-made consumption goods:
This second approach values the enviromental good with an implicit price in terms of market goods (with the marginal rate od substitution), telling us how much would the consumption of market goods need to increase to keep utility costant if the consumption of enviromental goods decreases.
Equivalence of dual discounting and RPC approach under CESWe now make the assumption of costant elasticity of substitution (CES) preferences for utility:
where is the utility share of consumption and us the elasticity of substitution, with .
With CES preferences (i.e. the utility function defined above), we get the following equivalence:
Note that is also the income elasticity to WTP (willingness to pay). The charts below represent the above model.
You can play around with it: please use this tool (from Lint Barrage and Moritz Drupp) to see the increasing value of scarce ecosystem!.
Literature distinguish between:
- weak sustainability enviromental goods are substitutable
- strong sustainability limited sustainability
We can model this difference in the CES preferences by setting , with the special cases of perfect substitues ( and perfect complements ($\theta = - \infty, \sigma = 0).
Baumgärtner adopted this view looking at what happens to our spending and consumption habits when we absolutely need a certain amount of nature to survive (subsistence requirement for enviromental goods, ).
If subsistence is satisfied, (), utility is given by:
In this model, the elasticity of substitution in non-costant and depends on relative to :
Limited Substitutability and the SCC
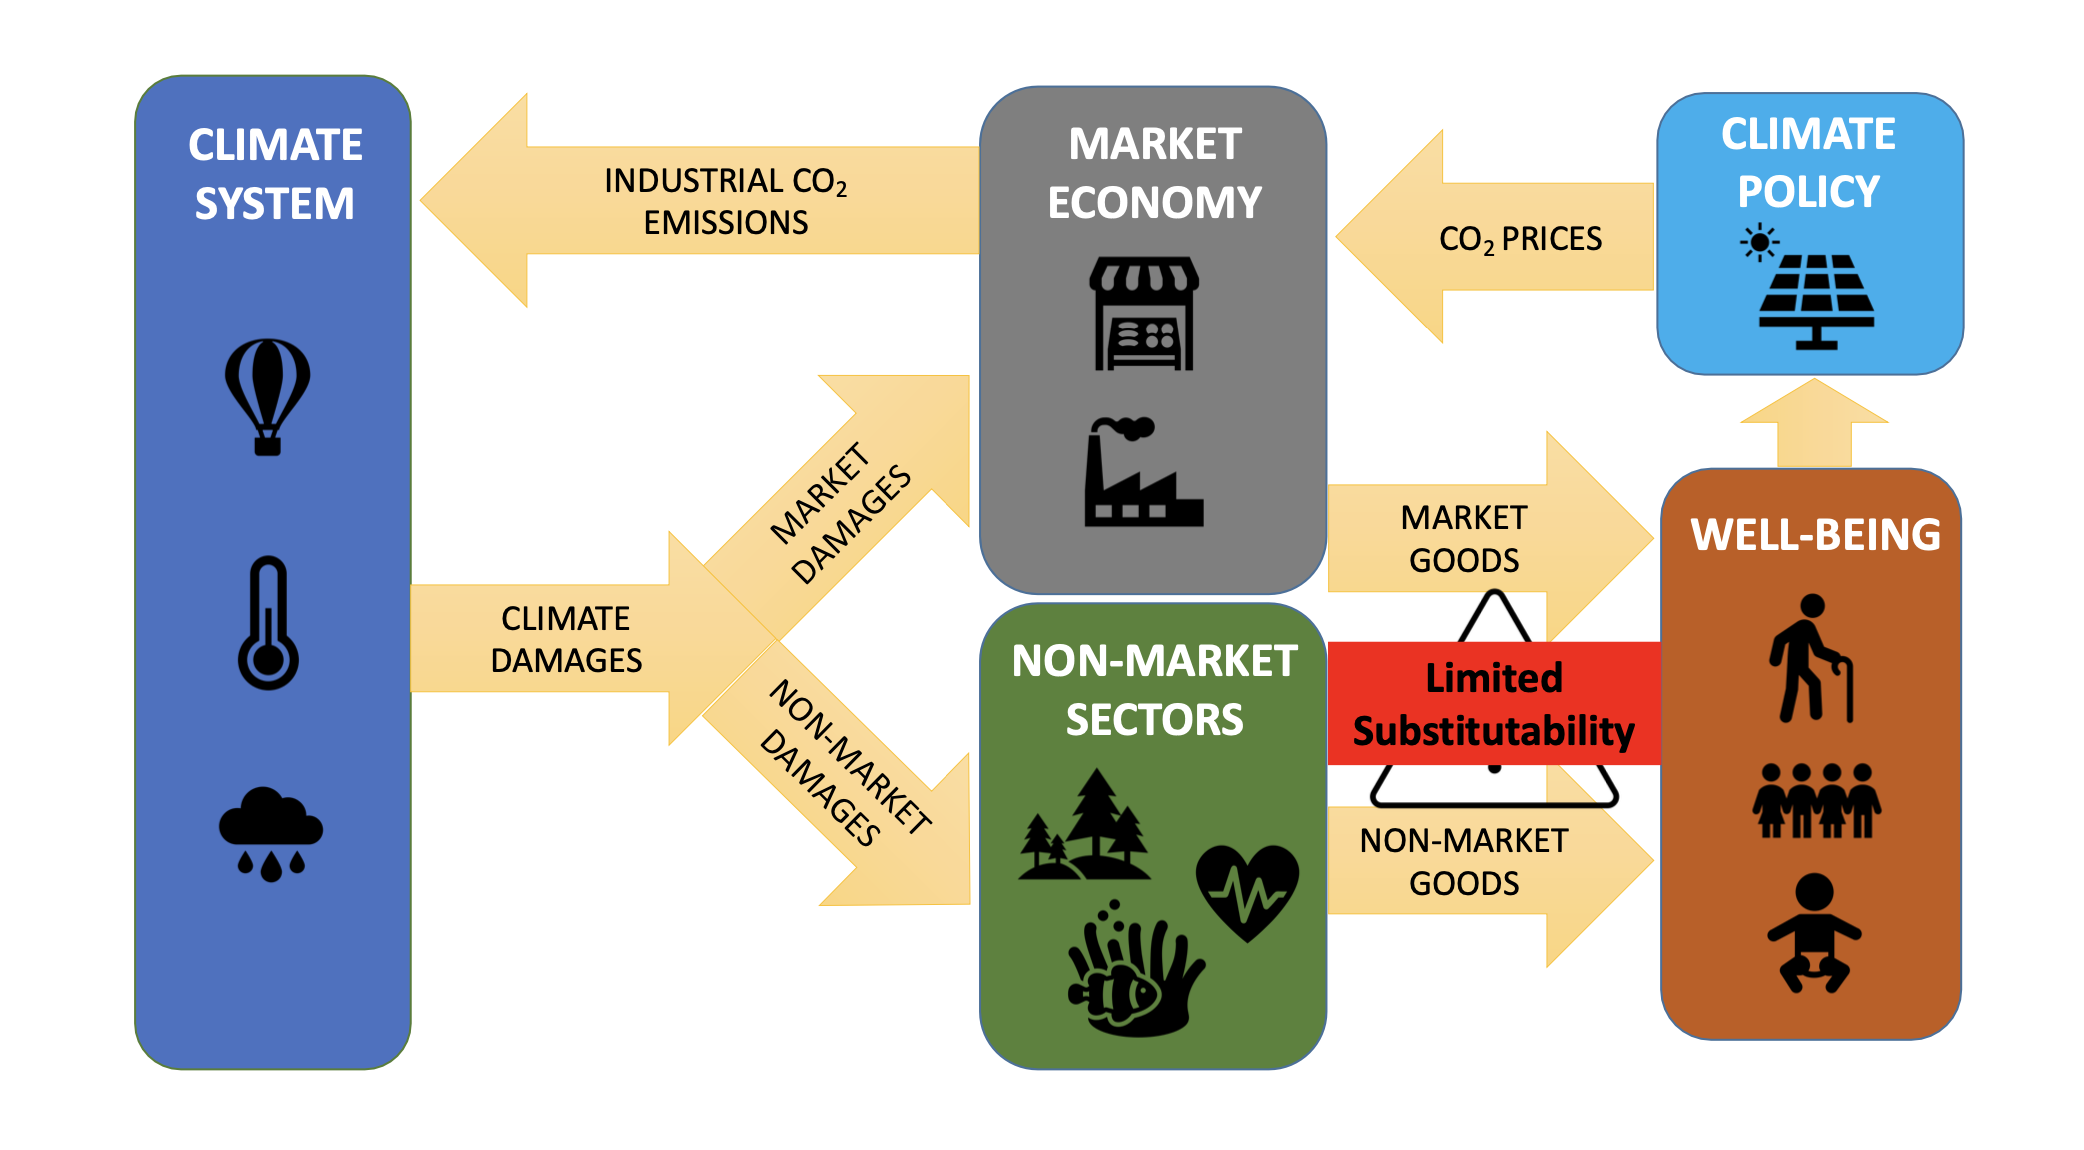
The degree of limited substitutability is often informed by expert assesments and non-market evalutations. Negleting limited substitutability in the central calibration would underestimated the SSC by 50% in 2020, as compared to perfect substitutability.
Extension (2): Intragenerationa inequalityWe use the standard isoelastic utility functio and the concept of equally distributed equivalent (EDE) level of consumption.
This tells us for some given degress of ineqaulity aversoin what (lower) consumption level is judged equivalent in terms of social welfare to the prevailing average consumption.
The EDE level of consuption is defined as:
where is the average operator and is the equal level that gives the same social welfare as the unequal distribution.
Assuming log-normal income distribtion, this yield the inequality-adjusted SDR:
Intuition: when people in the same generation have unequal consumption, social welfare should be evaluated using an “equality-equivalent” consumption level, not just average consumption.
Equity weightining in CBA
A dolar to the rich is typically considered less valuable than the same dollar to the poor thanks to diminishing marginal utility. Due to unequal incoes, monetized effects on the poor receive a lower weight in the standard CBA, but this can be "solved" with explicit distributional weights by assigning distributional weights to people with an income where is the median income:
For example, in the case of the Swiss SCC, equity weighening drammatically affects the result.
According to 2021 data, we indeed have that:
- Utility discount rate of 1%, no equity weighting: CHF
- Utility discount rate of 1%, equity weighting: CHF
- Utility discount rate of 0%, equity weighting: CHF
However, if we are interested primarly in determining an efficient interanlization of the climate externality fiven the current status quo distribution, we'd likely NOT perform equity weighening. If, on the other hand, we are also intered in equity, we should perform a equity weightining.
Extension (3): Uncertainty in the model
| certainty | risk | uncertainty | ignorance | |
|---|---|---|---|---|
| Possible states of the world | a single one | many, known | many, known | unknown |
| Probabilities | 100% | objectively given | not objectively given | not given |
Many risks of uncertainities:
- about economic development and emissions
- about climate change given emissions
- about climate damages given climate change.
In general, this leads to:
- precationary savings higher SCC
- insurance ambiguous effect on SCC
If growth in each year id indepdently and identically normally distributed, we can use a Extended Ramsey Rule (ERR):
with where is the mean of the real pre-capita logarithmic conumption and its variance.
Note that, climate change has a "fat-tail". The chart below show the climate sensitivity's distribution density function derived from different studies.
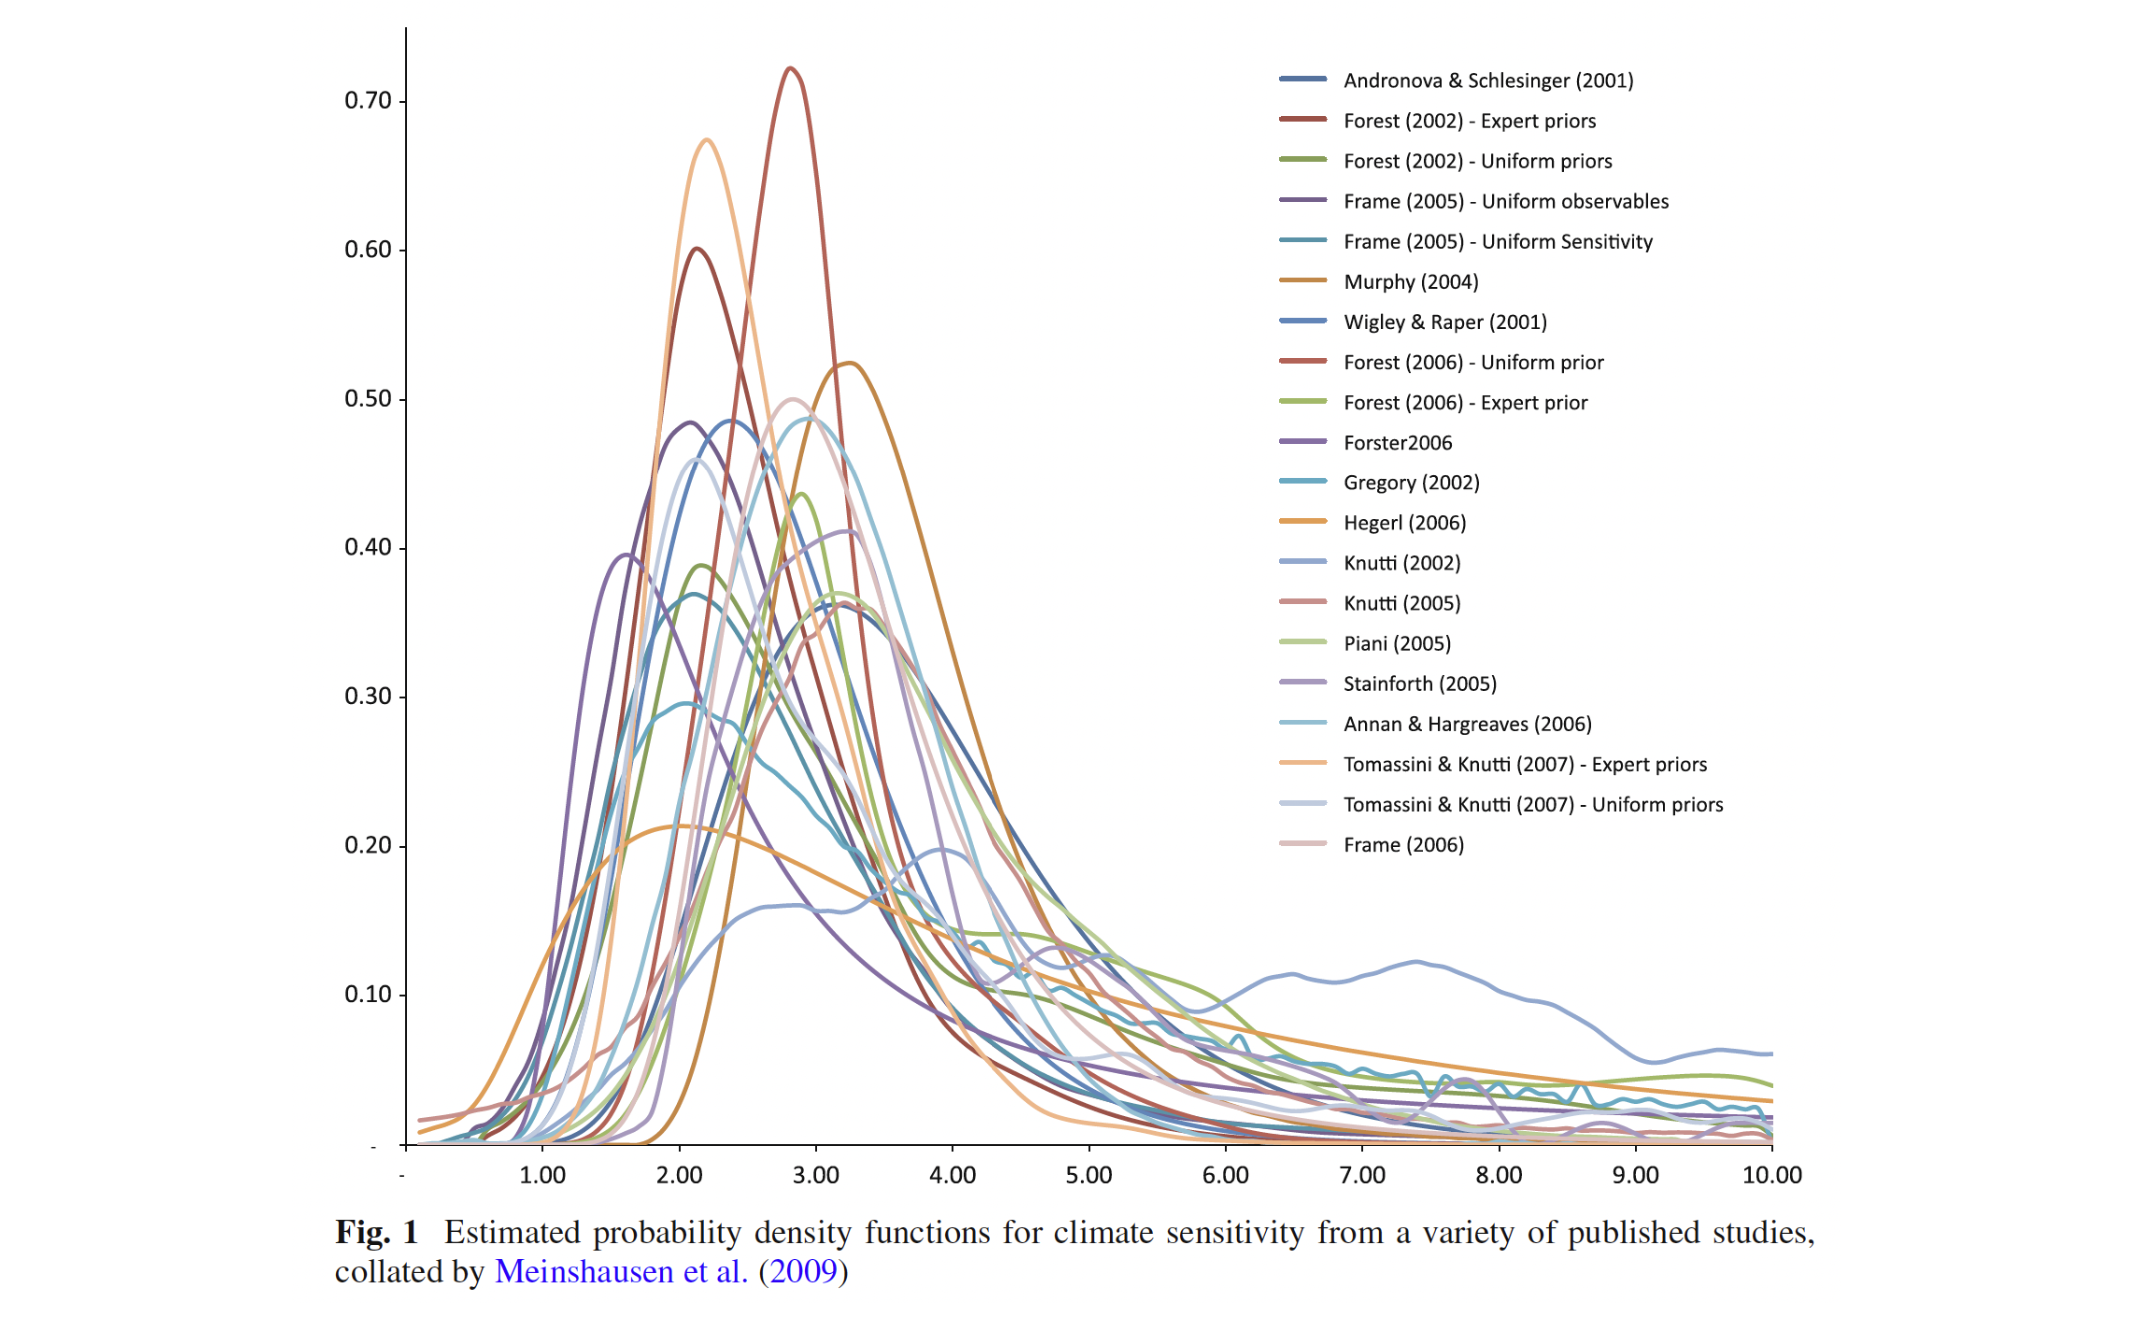
This theorem can emerge in the standard model under uncertainty if:
- the bad tail of climate damages has sufficieently fat probabilitiy
- society is sufficiently risk-averse ()
The theorem them states that, even if the benefit of averting (avoid) each potential catastrophy exceeds the cost, we should not necessarily avert them all.
Alternative models and ethical approaches are then needed to deal with theese uncertainities:
Instead of imposing a social welfare function (including pure time preference, inequality aversion) and calculate the corresponding optimum, it is “better” to depict a set of feasible paths of consumption, production, temperature, income distribution, etc. and let policy makers choose.
Rather than using a discounted-utilitarian approach [...], I would recommend to the governmental body to use a ”Tolerable Windows”-approach. That is: set limits in physical terms to the future development that must not be exceeded for reasons of intra- and intergenerational justice, e.g. on climate change, biodiversity loss, infrastructure deterioration/enhancement, education level, life/health expectancy etc...). Then, use a discounted utilitarian approach to optimize development only within these limits.
Some other alternatives:
- Sustainable discounted utilitarism: Maximize the sum of discounted utilities and assign a zero utility discount rate if the present is better off than the future.
- Maximin: Rank alternatives by their worst possible outcomes and adopt the alternative for which the worst possible outcome is better than all the other worst outcomes.
- Safety first: Maximize social welfare subject to the probability of the welfare of the worst off being less than some safety threshold
- Non-Consequentialist approach:
Summary: SCCs in perspective
| Source | SCC estimate (USD/tCO2) |
|---|---|
| Nordhaus (2018) | 36 |
| Barrage and Nordhaus (2024) | 50 |
| United States, EPA (pre-Trump) | 190 |
| Haensel et al. (2020) | 210 |
| Switzerland, Infras for BAFU (2024) | 500 |
| Germany, EPA (2024) | 330 or 880 |
differences are largely driven by:
- assumptions on discounting
- damage estimates
- model structures
We then identified 1823 SCC estimates from 147 papers, following this distribution:
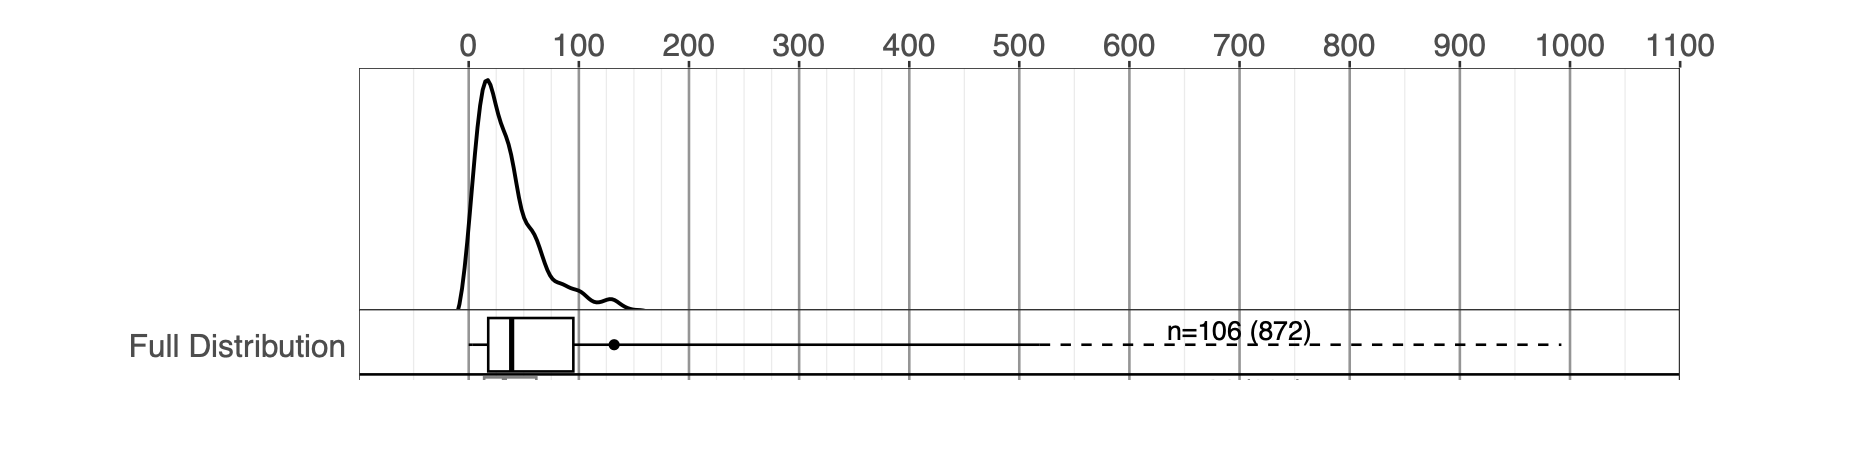
The following plot shows then how do SCC distributions vary along structural changes:
However, if we see data from 2020, we notice that experts understedimated the SCC.
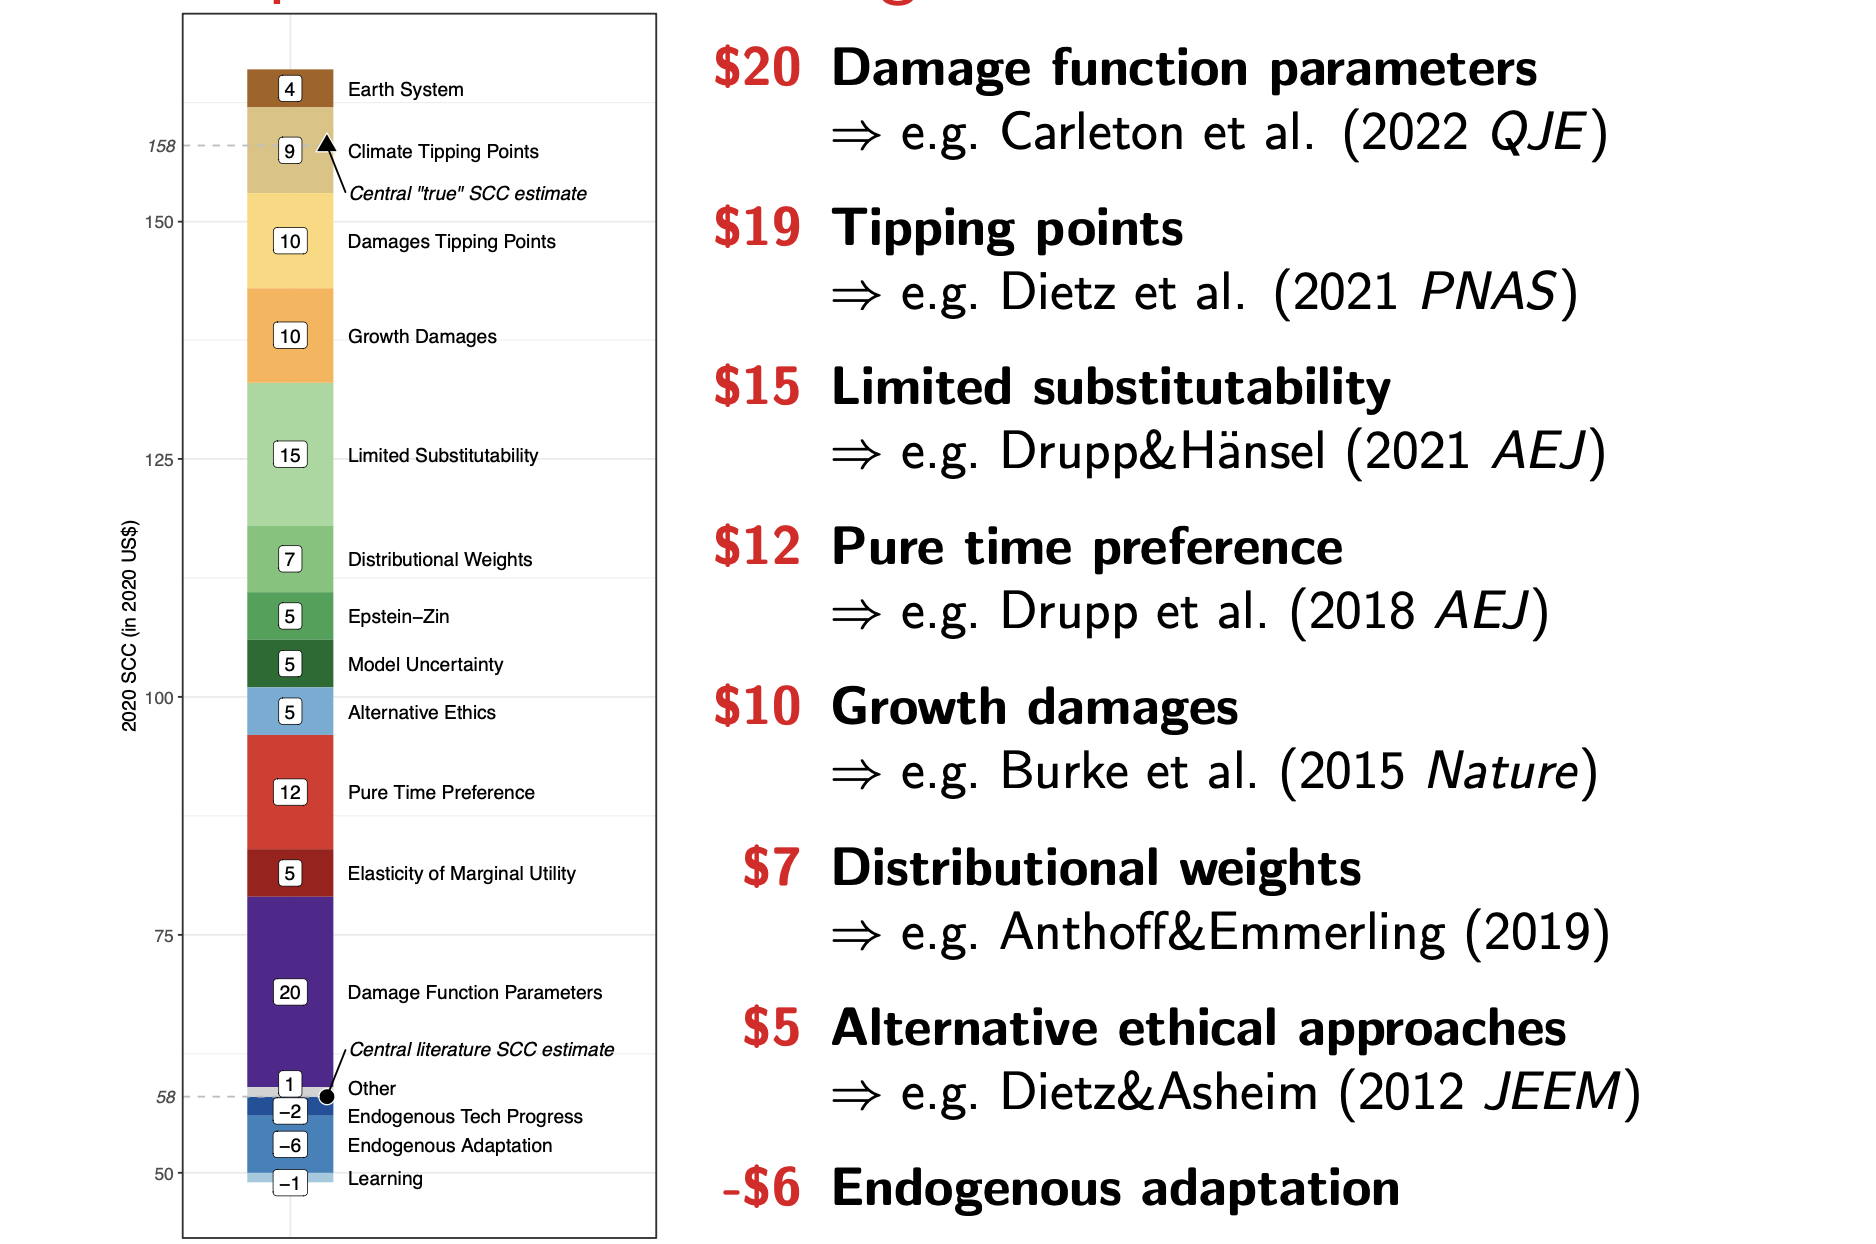
- Estimating the Social Cost of Carbon (SCC) is fraught with uncertainty and ethical contestation, and requires multiple methods and disciplines.
- SCC estimates in the literature are likely biased downward.
- About 50% of experts’ SCC wedges relate to climate risks (damages and tipping points), followed by ethical issues (about 25%), substitutability (about 15%), and uncertainty (about 10%).
- A synthesis of evidence yields an SCC of about 300 CHF per metric ton of CO2 (2025 values).
- This is roughly 0.75 CHF per litre of gasoline.
- This is about the same order of magnitude as the Swiss mineral oil tax, which is not environmentally motivated (it finances infrastructure).
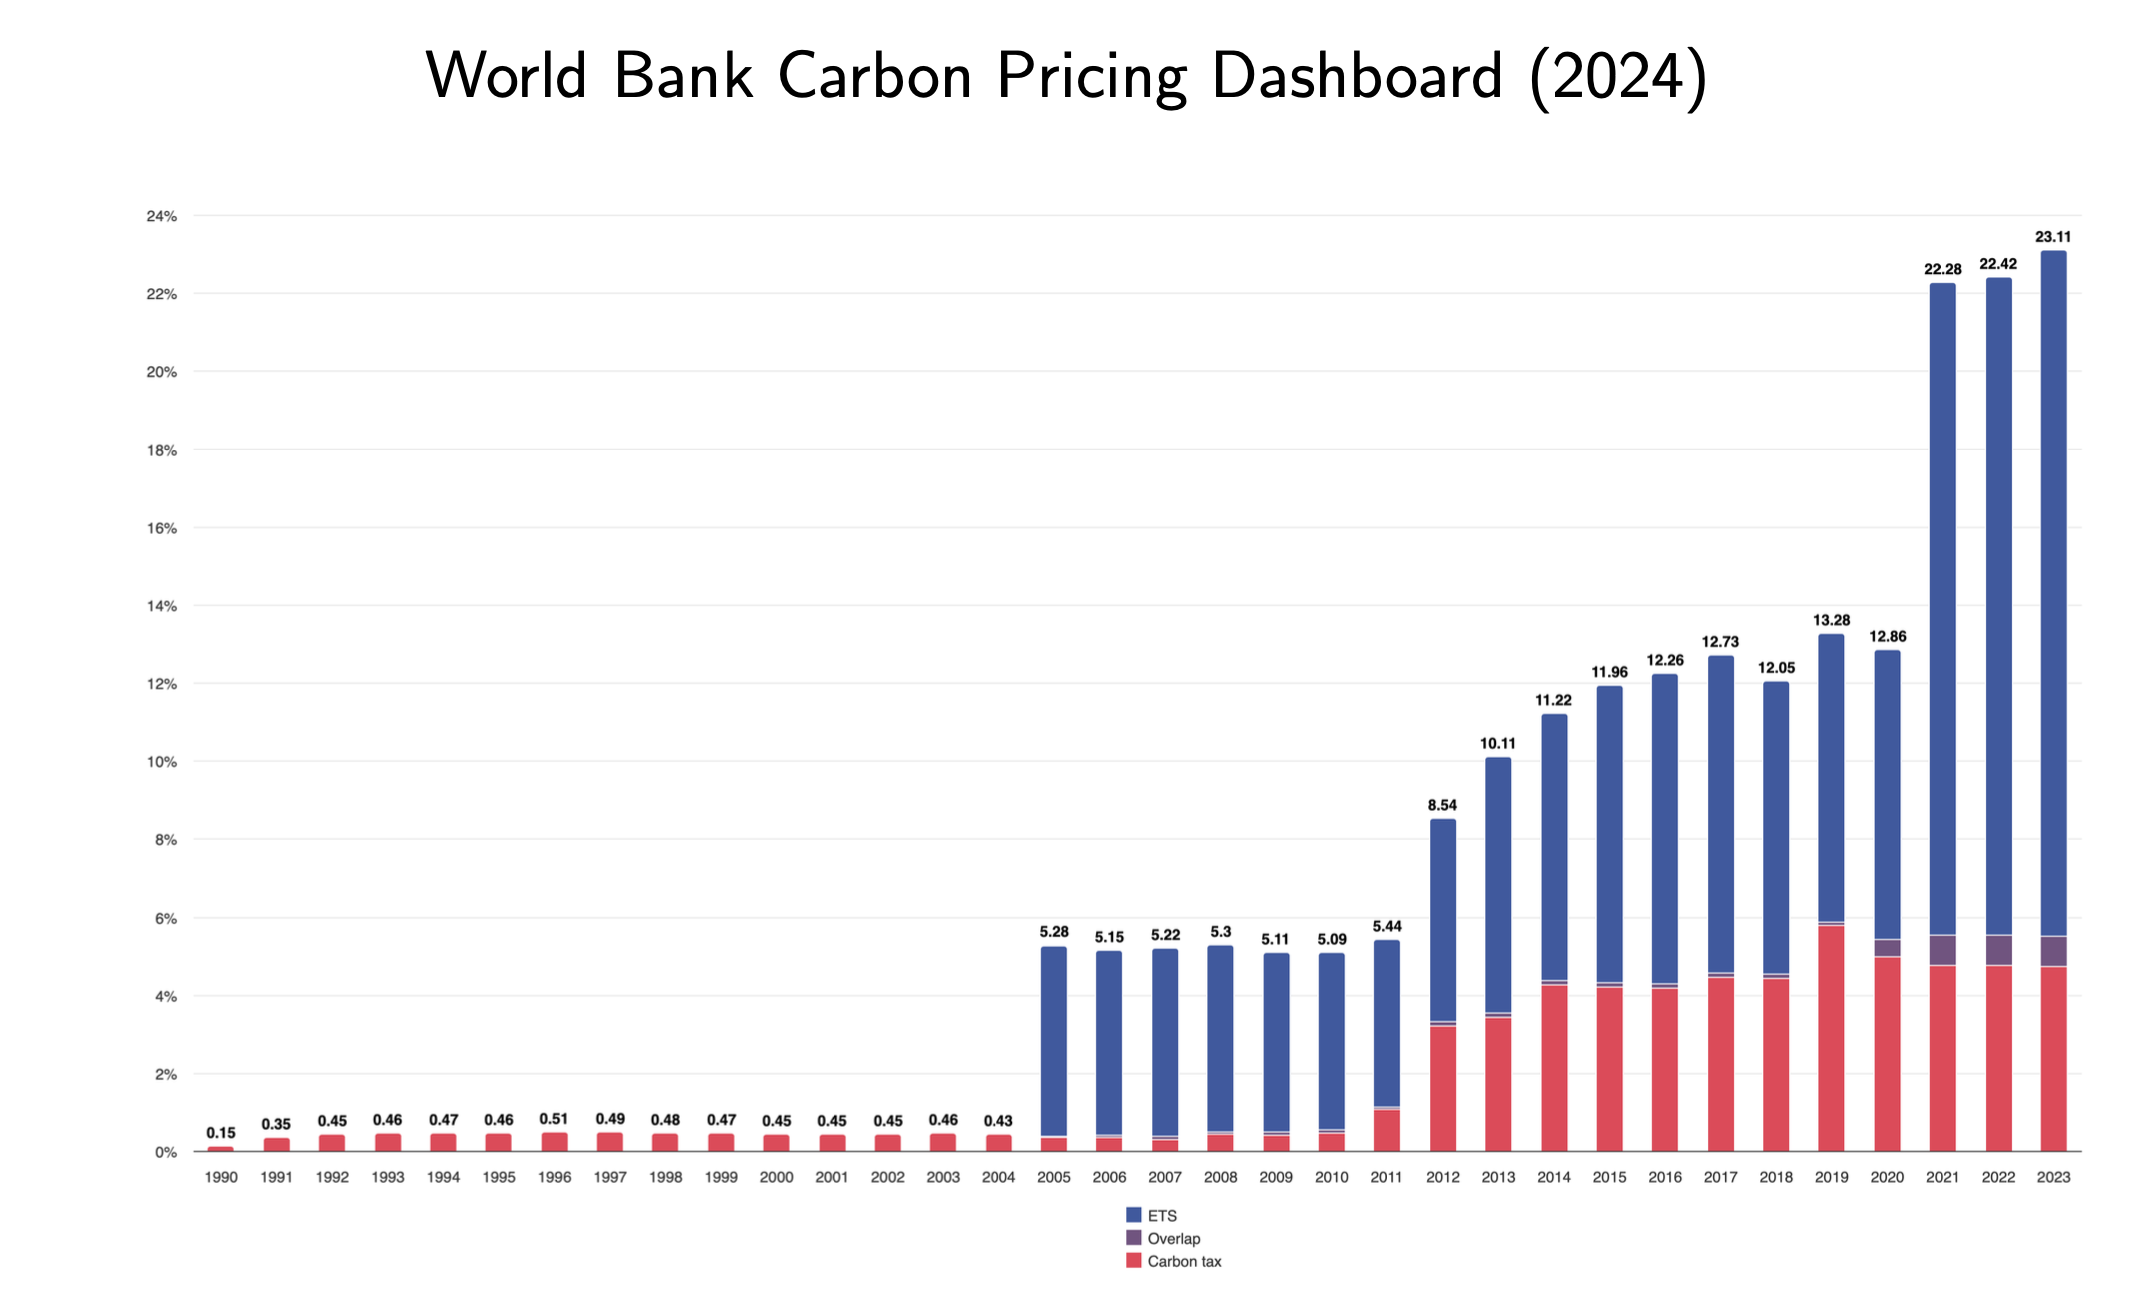
- It is higher than all explicit carbon prices (World Bank, 2025); for example, the Swiss CO2 tax on industrial fuels is the second highest at CHF 120.
Therefore, there is a strong economic case for more ambitious climate policy.
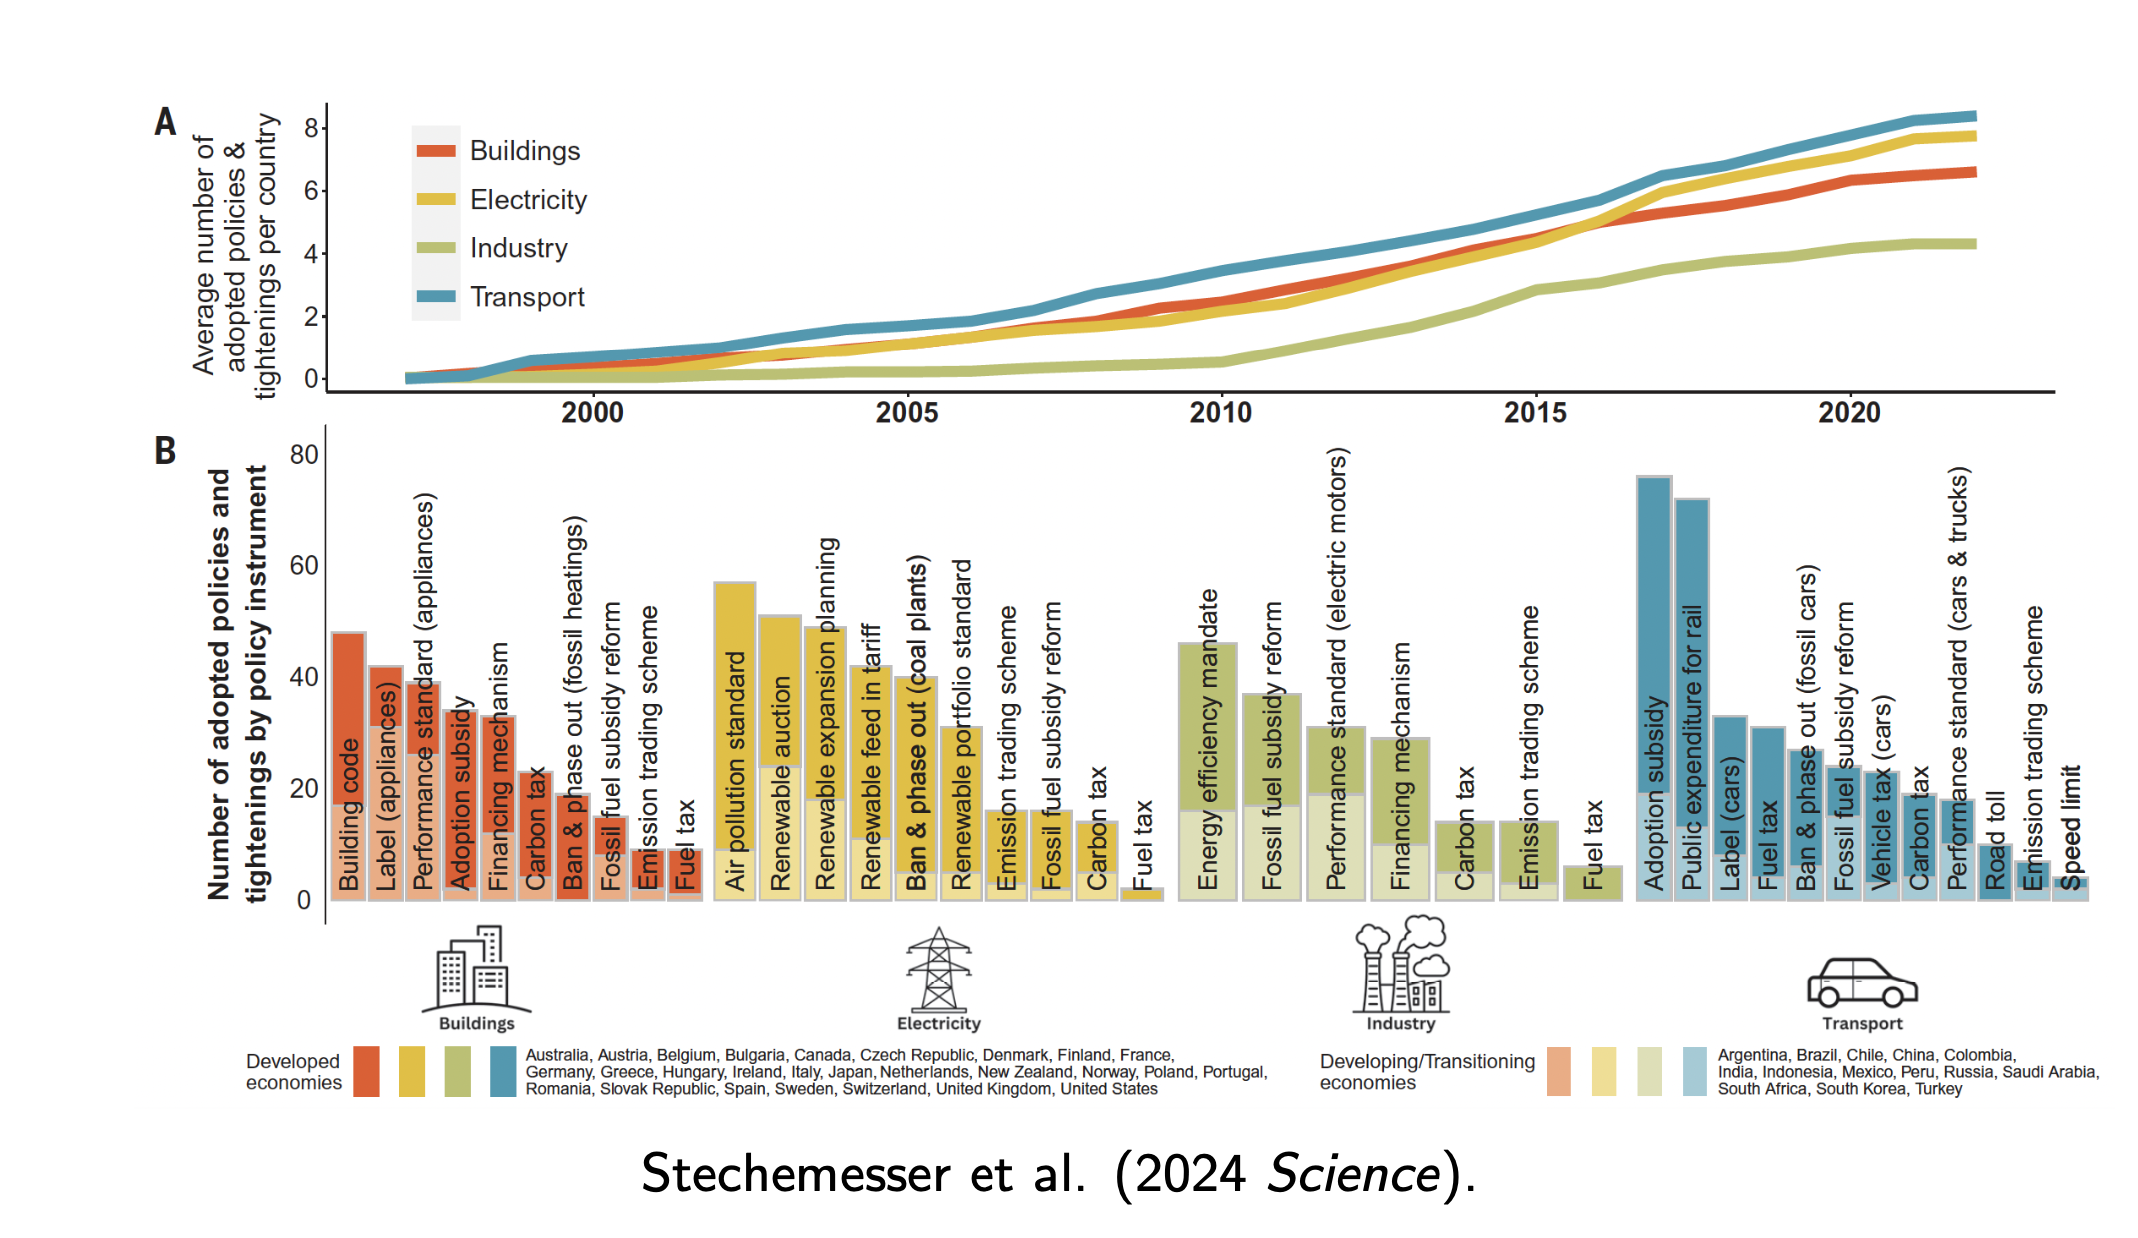
11. Environmental Policy: Instrument Choice, Efficiency and Effectiveness
When applying a enviromental policy, there are are several instruments available:
- Law: bans, standards
- Market-based instruments: taxes, subsidies, emissions trading
- Others: feed-in tariffs, infrastructure planning, green R&D, education, information, nudges...
On average, enviromental policy leads to costs that will be payed by houseolds but usually the extra cost is minimized if externalities are reduced where it is cheaper to do it.
The marginal costs of emitting a ton of CO2, for example, should be equal to the marginal benefits of avoided damages.
Bans and standard are sometimes easy to understand and introduce but, due to the binding costraints, marginal abatement cost will differ across economic agents, leaving benefitial trades on the table.
ETS can yield the same effectiveness by setting an hard cap, but due to the trading of permits, emissions can be reduced where it is least costly to do it, also allowing to generate revenues for government (that can be recycled back to houseolds or firms to correct undesired distributional effects).
More about Carbon Emission Trading [Wikipedia]Similarly, CO2-taxes, while still aiming to uniform the CO2 price, are often easier to indtorudce but bring a negative connotation. They send a clear price signal but there's uncertainty about how much reduction they will introduce.
On the other hand, ETS are designed to meet some quantity reduction (given that the purpose is to limit climate change by creating a market with limited allowances for emissions) but there's uncertainty about costs and CO2-prices can be volatile, making investment planning more difficult.
Given the situation, some "hybrid" approaches, such as an ETS with flexible min and max prices (price collar) are implemented.
From a welfare perspective, it is even better to choose a flexible version in-between, a so called "smart cap" with may eliminate the welfare costs of assymetric information on abatement costs.
In this scenario the government creates a supply curve for CO2 permits that matches the expected slope of the environmental benefit, ensuring that:
- When abatement is cheap: The cap automatically tightens (fewer permits), forcing more emission reductions.
- Wen abatement is expensive: The cap automatically relaxes (more permits), preventing economic collapse.
Generally speaking, we should not rely solely on emissions pricing.
- There are related failures related to this approach
- Regulatory policy has been an important component, also because it is generally more accepted than market-based instruments.
DO CO2-prices redue CO2-emissions?
In general: Yes!, but it is not so easy to demonstrate, as we would need to compare the actual development with a counterfactual one, where the world have developed in absence of CO2-price.
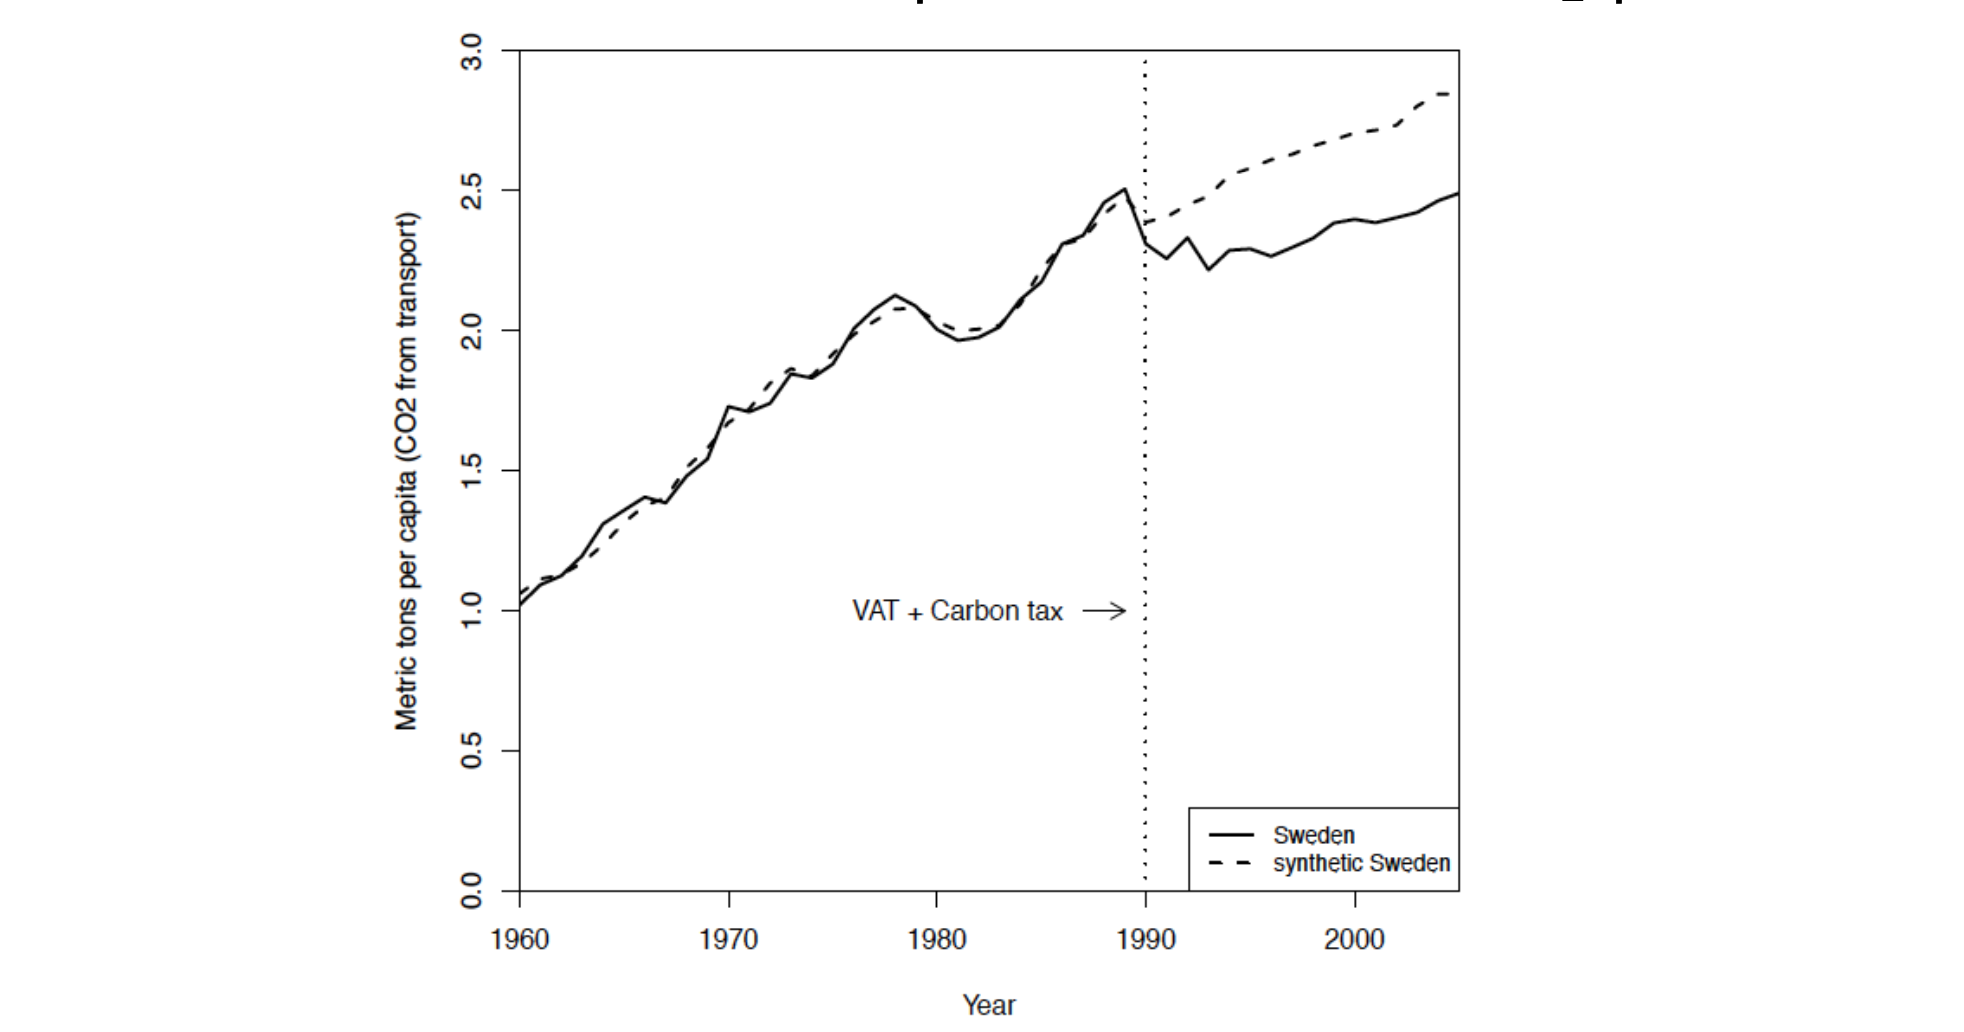
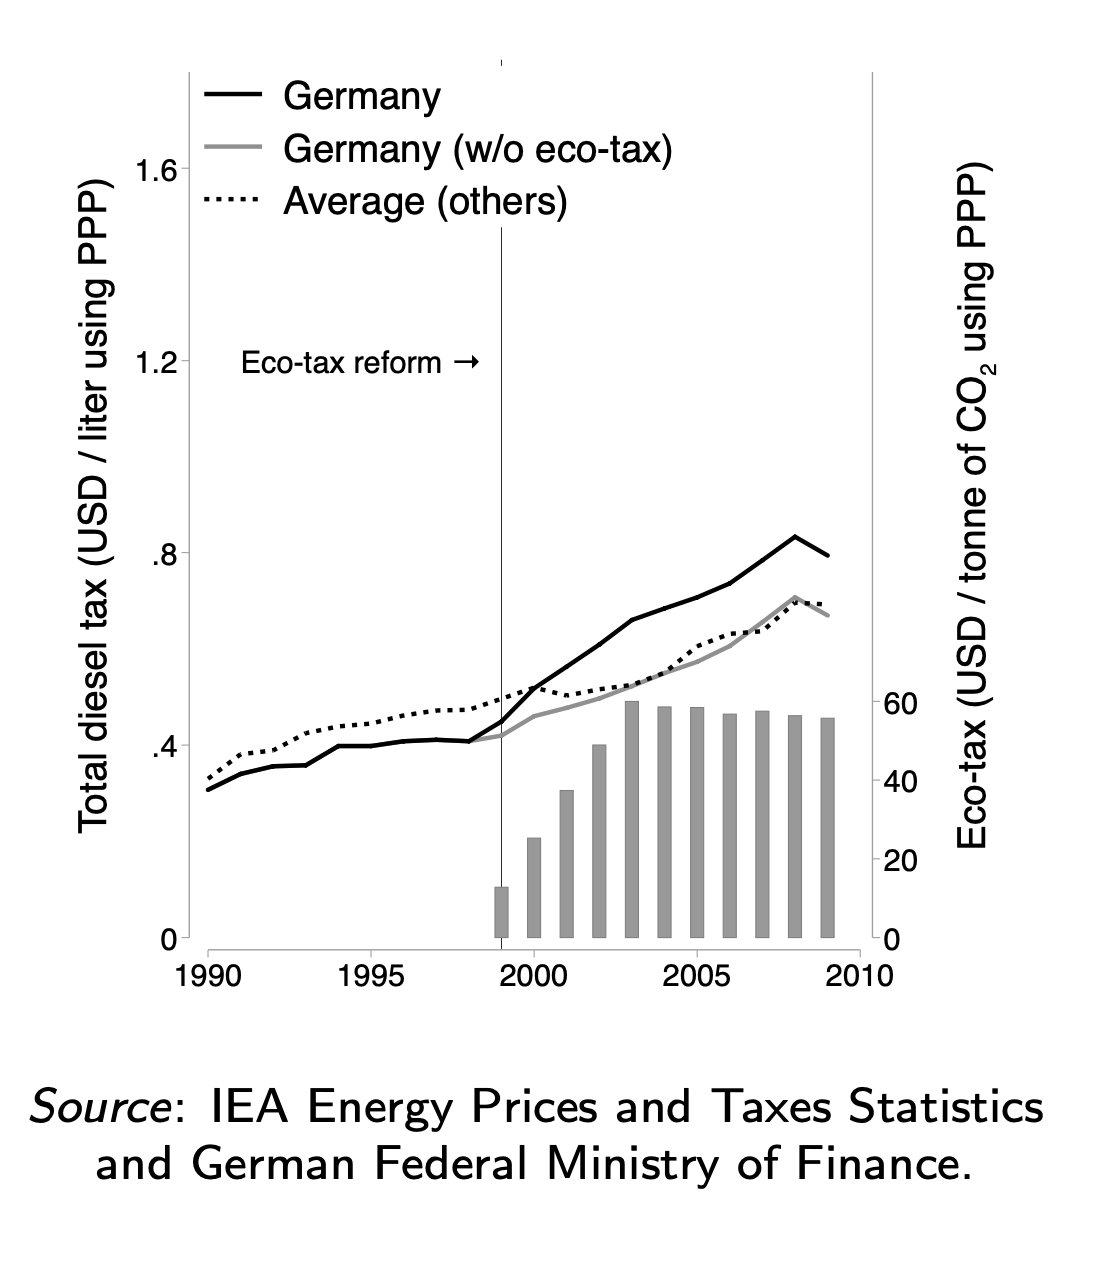
For example, the 1999 ecological tax reform in Germany raised taxes on petrol, diesel, electricity and natural gas in 1999-20003 with a "sizable implic price" of 84 dollar for ton of CO2 from diesel, second in magnitude only to the Swedish carbon tax (but on a much larger bases). Then Germany used these revnues to cut non-wage labor costs, reducing pension contribution. In this case, health-benefits account for $\approx 2/3% of reduced damaged of the tax on trasport fuels.
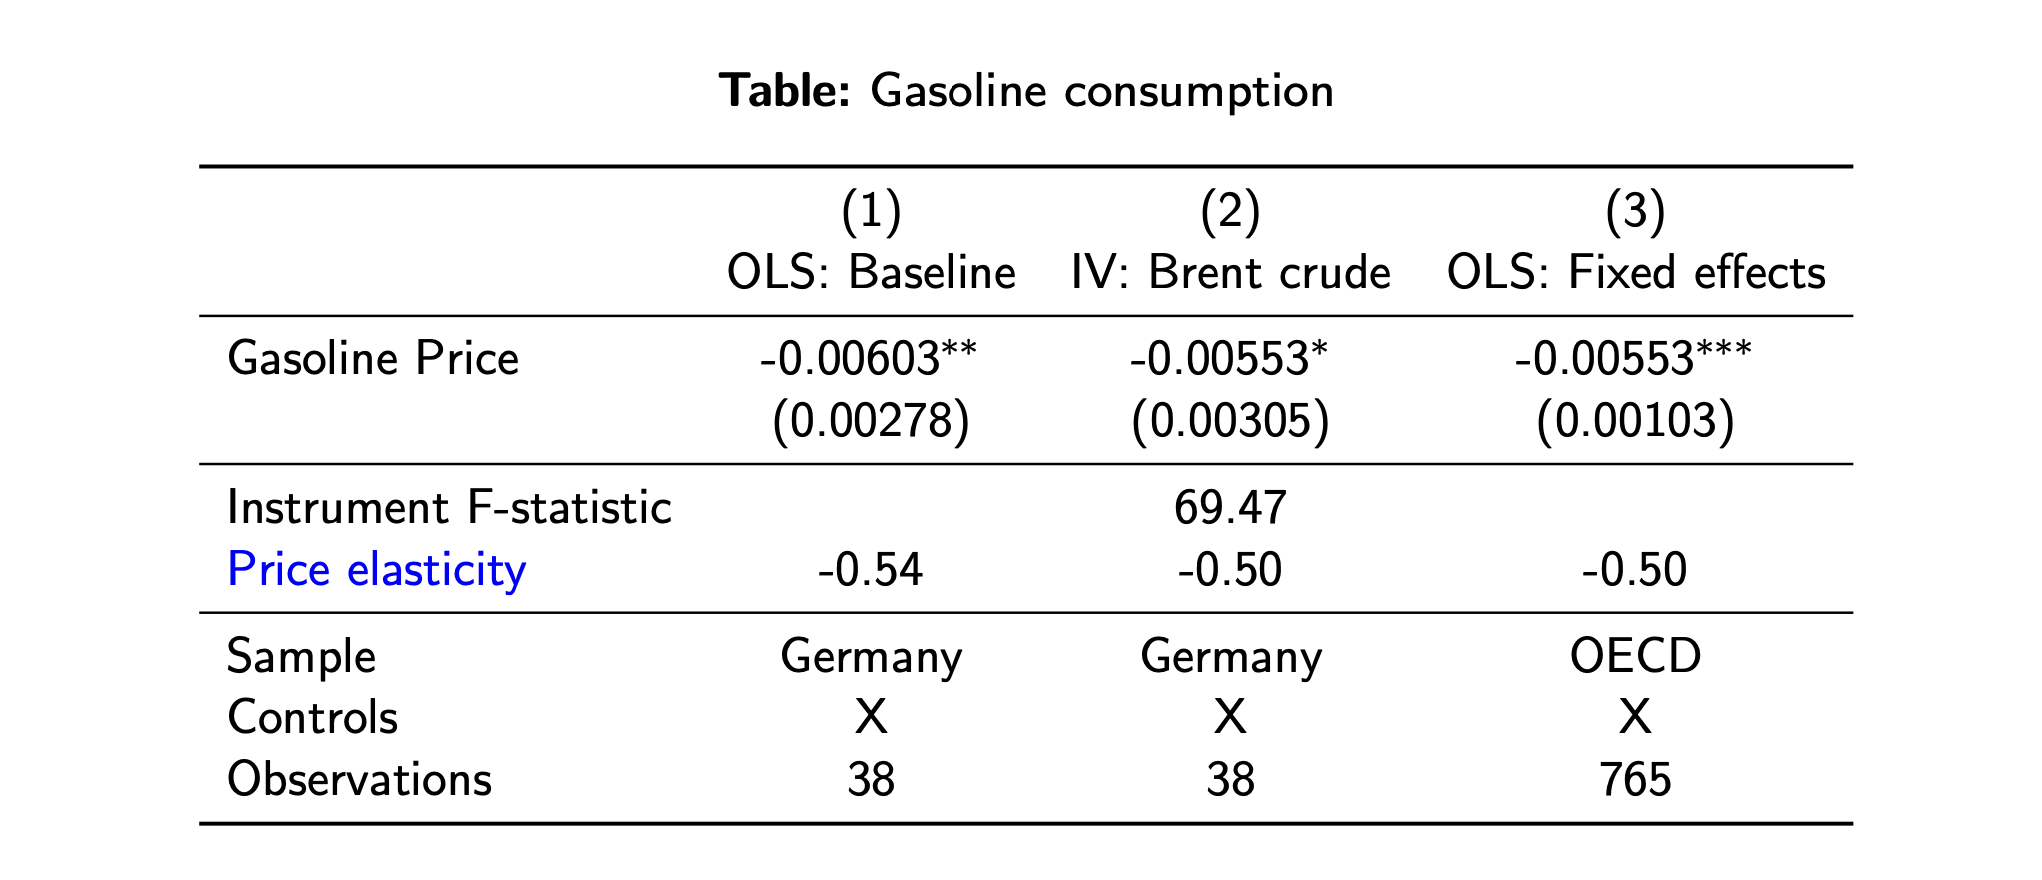
The following equations estimate the fuel consumption per capita in relation to time trends (macro or tech developement) and country specific effects:
The Real Price Elasticity Model focuses on the aggregate price effect:
The Eco Tax Elasticity Model focuses on on decomposed tax effects:
where:
- : Fuel consumption per capita (logged).
- : Total real fuel price. -: Price excluding taxes _(market price + VAT)._1
- : Real eco tax rate.
- : Real energy tax rate.
- : Post-1999 Reform dummy variable.
- : Country-specific fixed effects.
- $\epsilon_t£: idiosyncratic error term
12. Environmental Policy: Distribution, Re-distribution and International Cooperation
Intuition: If the gasoline price rises by 1%, then gasoline demand dropbs by 0.5%, i.e. if we sought to reduce gasoline demand by 15%, the price would need to increase by 30%
In summary, we can say that the demand response to an enviromental tax is much larger tham the equivalent market-price effects, likely driven by tax salience and expected persistence.
Effectiveness of emissions trading
The European Union Emissions Trading System (EU ETS, introduced in 2005) is te largest supra-national ETS in the world, it regulated almost half of the EU's CO2 emissions by:
- setting a cap on the max number of emissions
- reducing the cap over time (with the goal to reach zero emissions by around 2040)
Generally speaking, we can say that, Yes, the EU ETS has reduced emissions.
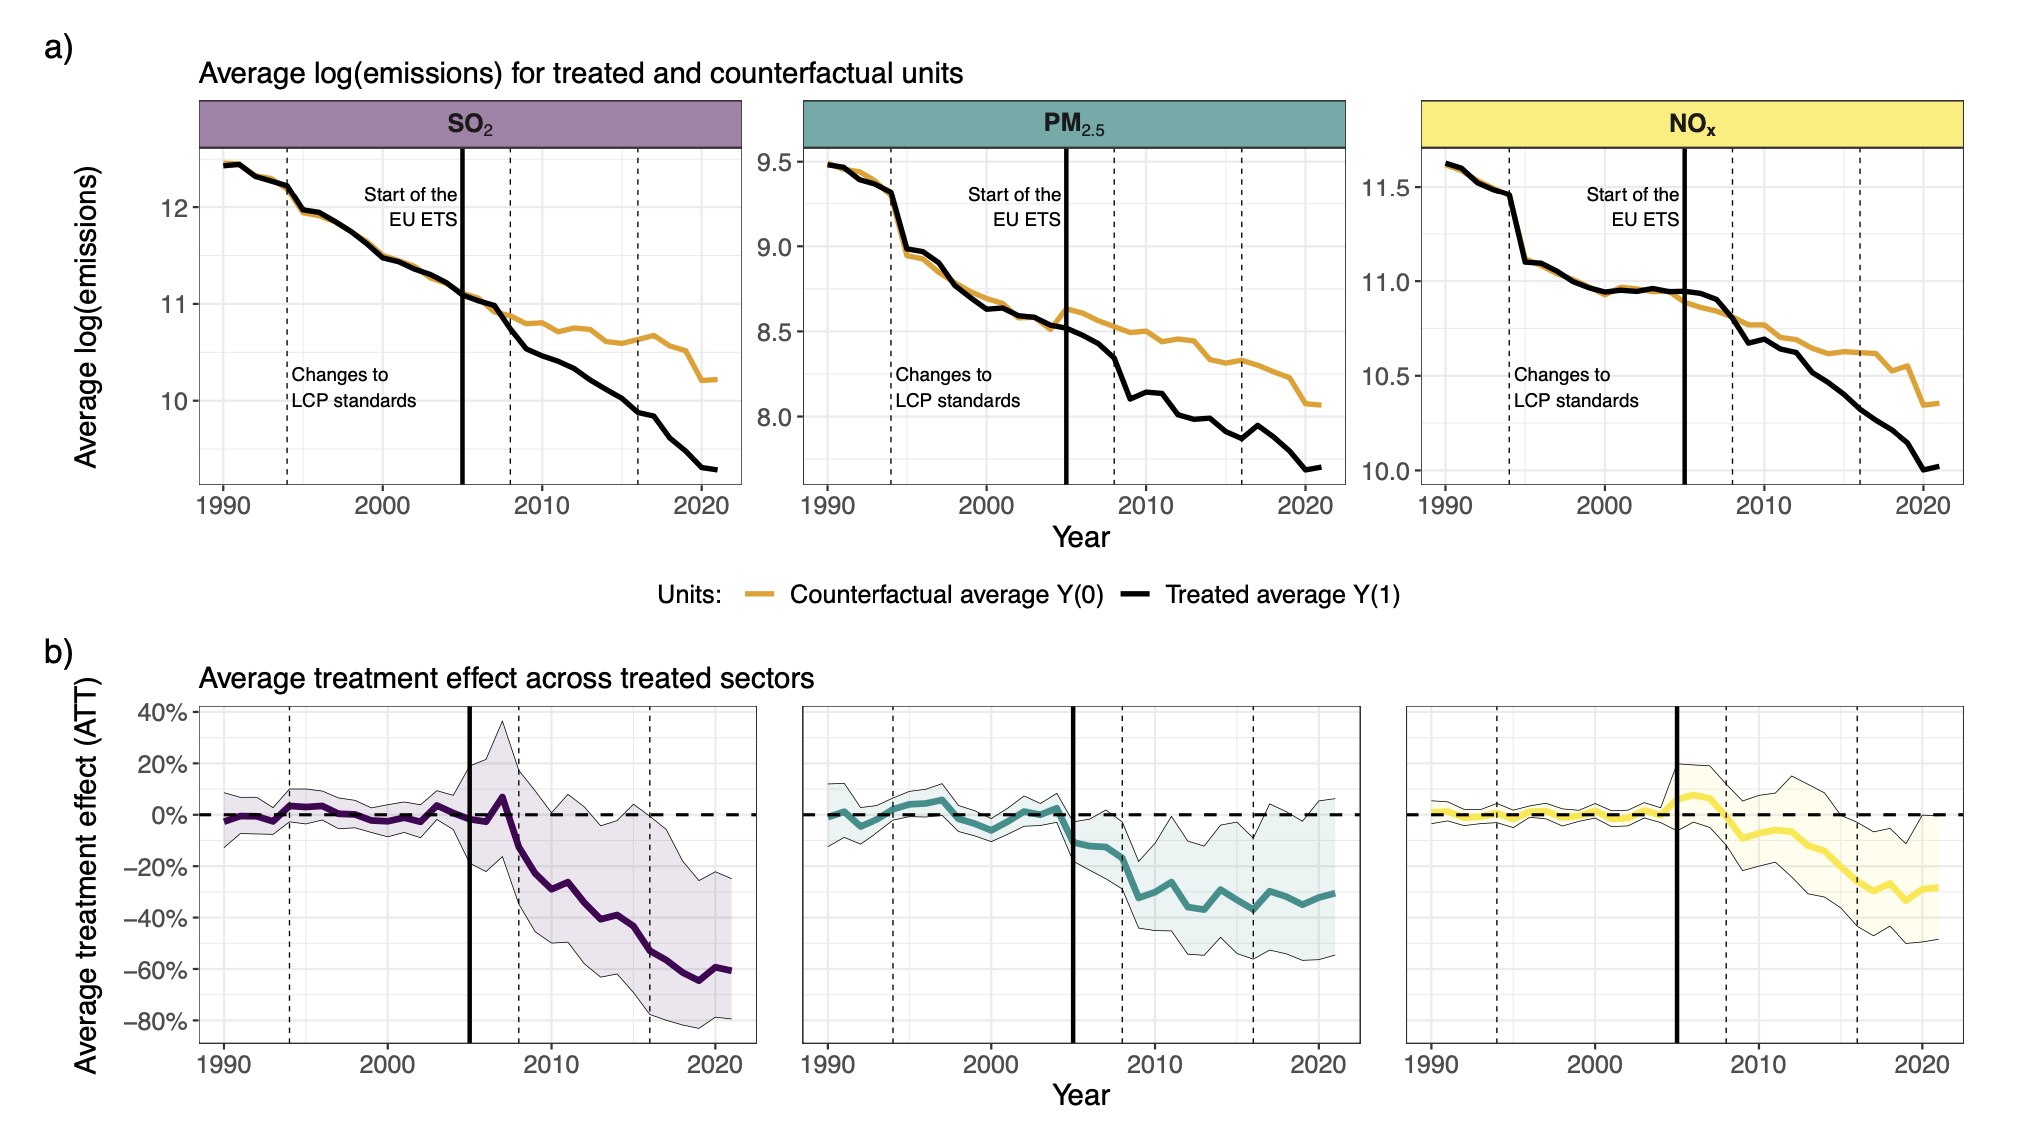
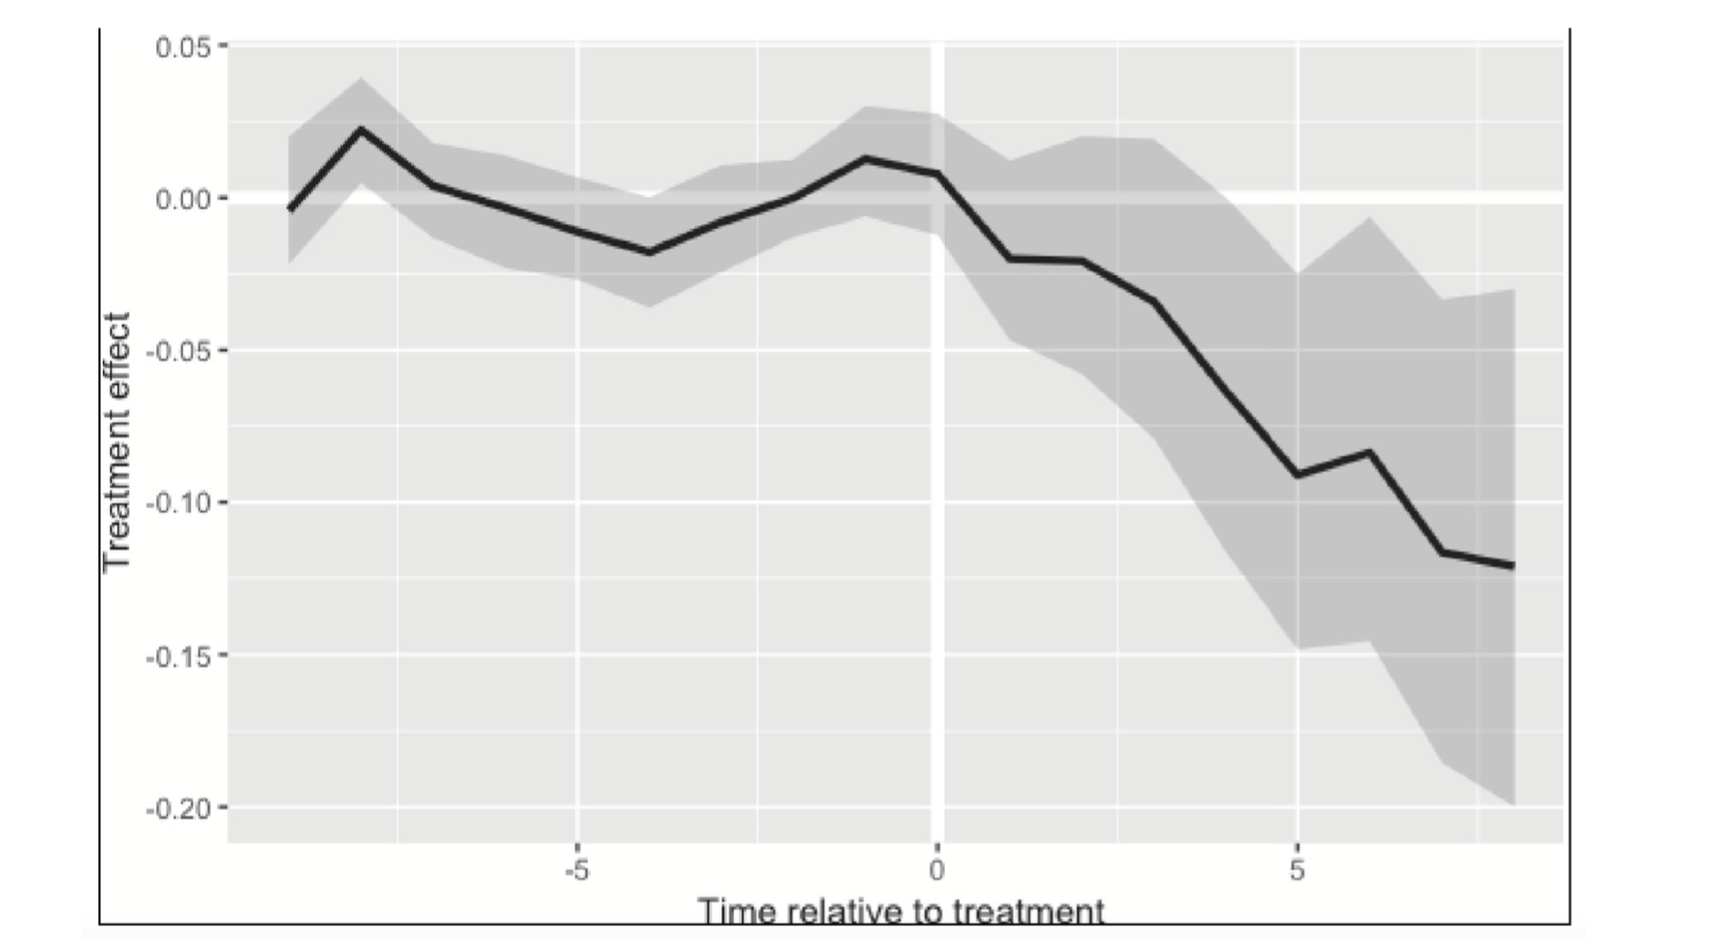
- Colmer et al. (2024 ReStud):
“Using administrative data, we estimate that, on average, the EU ETS induced regulated manufacturing firms to reduce carbon dioxide emissions by 14-16%, with no detectable contractions in economic activity.” - Bayer&Aklin (2020 PNAS):
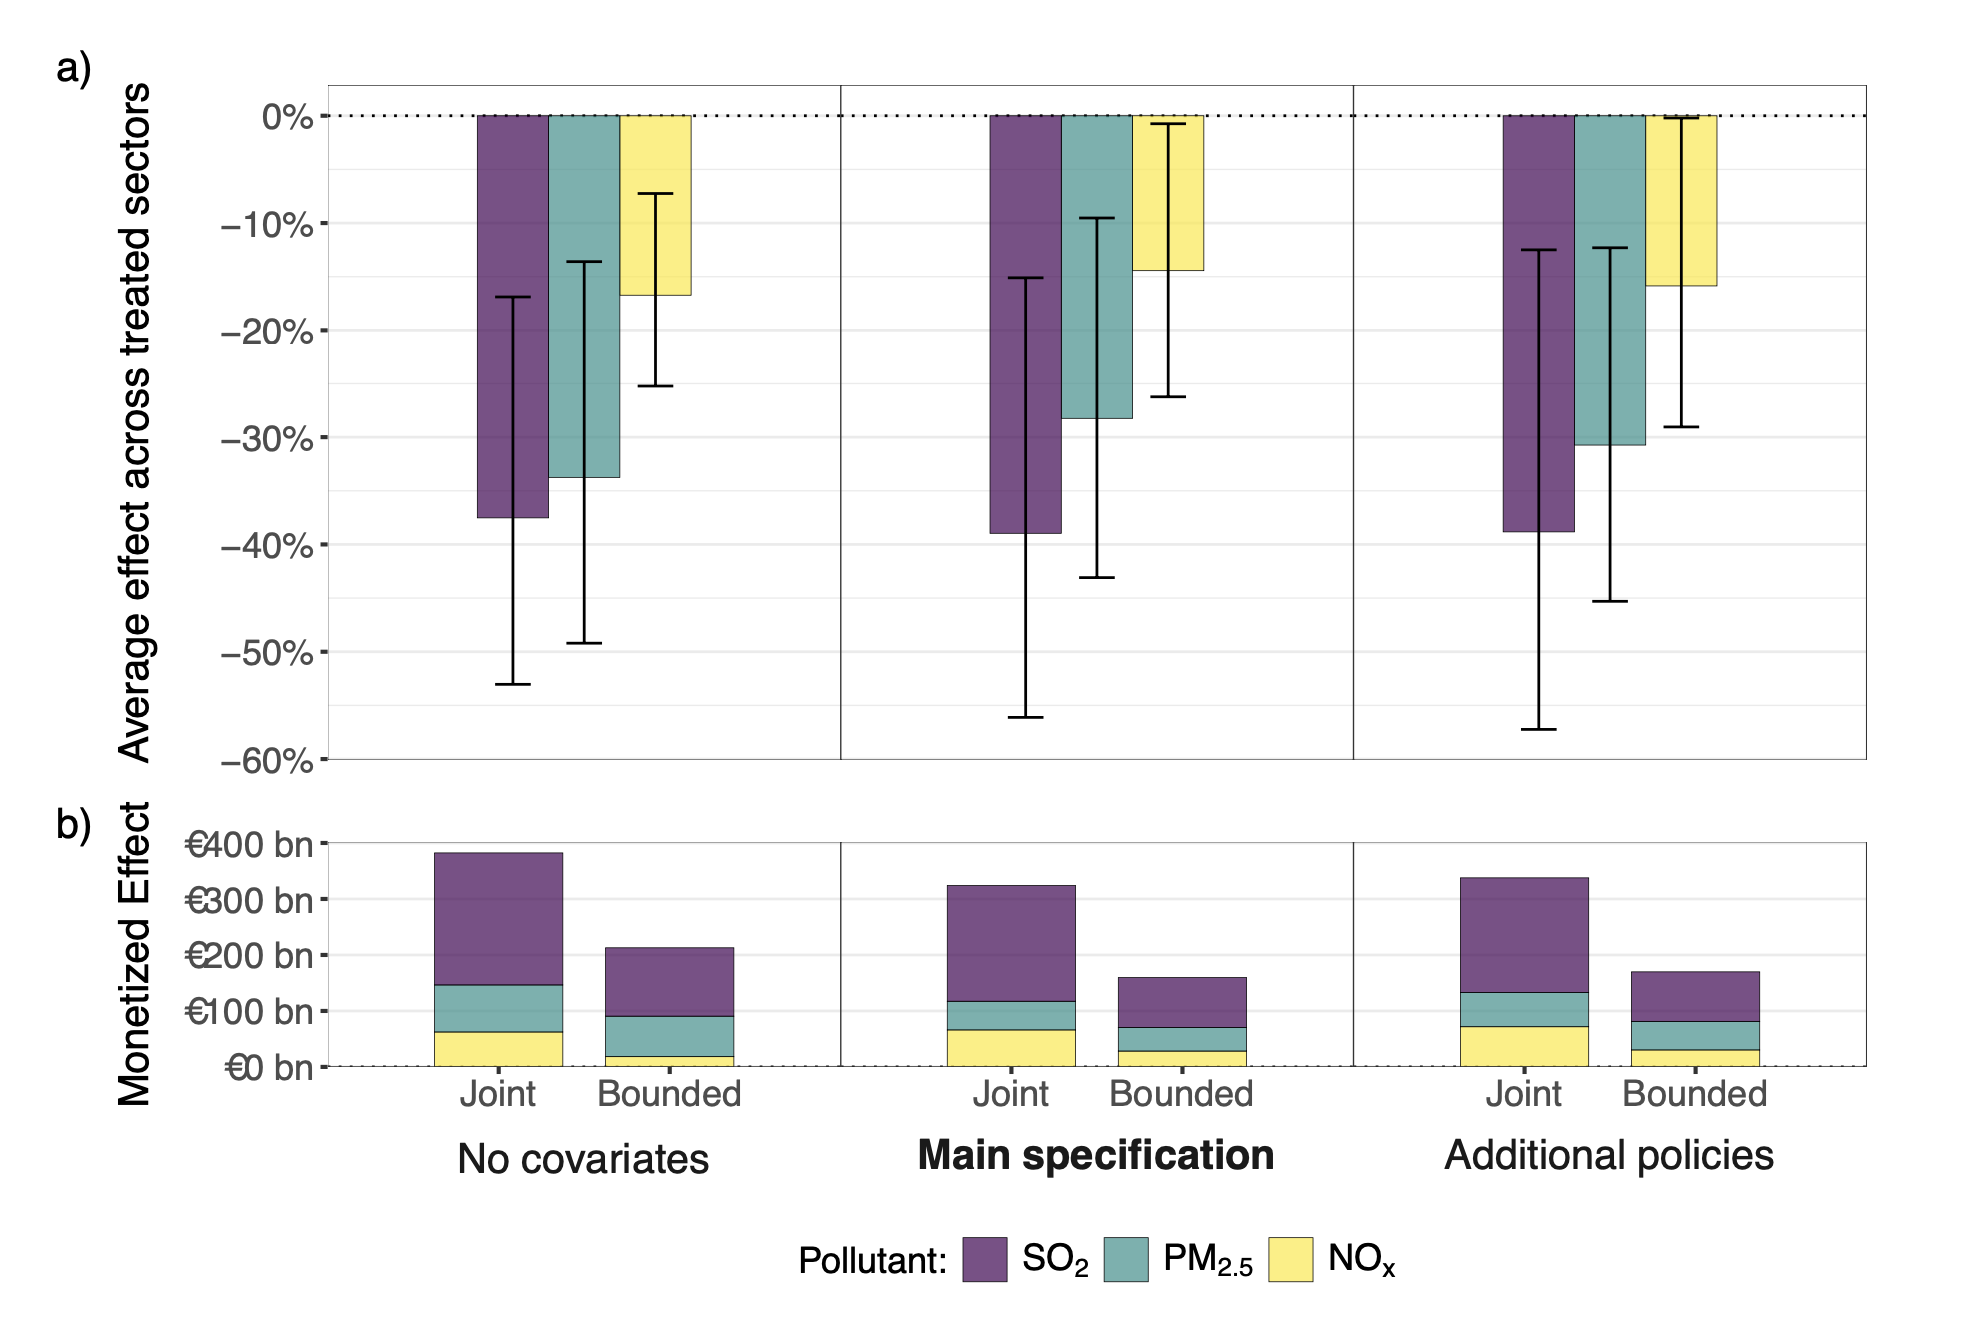
"CO2 emission reductions relative to the counterfactual without the EU ETS are estimated to be around 8% between 2005 and 2016." - Basaglia et al. (2024 PNAS):
"EU ETS has also reduced air pollution, when quentified in monetary terms in the order of hundreds of billions of Euros."
To prove that generalized synthetic control method (GSCM) is used to generate counterfactual pathwars for SO2, PM2.5 and NOX emissions with a weighted combinatio of unregolated sectors.
To sum up, we have different souces of evidence that both taxes and ETS can reduce emissions, but the extent to which they are successful varies, so we end with the following question: "do CO2 prices reduce CO2-emissions also if the raised revenue is re-distributed back?"
The answer is still yes! but:
- CO2-pricing changes the relative prices of clean vs dirty inputs and goods (CO2-intensive goods become more expensive)
- If revenues are re-distributed with a lump-sum, then the steering effect of carbon pricing remains intact
- if revnues are used such that the steering effect is watered down, for example by making polloutig goods cheaper again, then this counteracts the reduction.
Environmental Policy: Distribution, Re-distribution and International Cooperation
In order to understand how to efficiently recycle the revenues from the policies, we need to know:
- how the costs are distributed (consumption costs, use-side costs, labor costs, capital costs)
- how the benefits are distributed (avoided damages and co-benefits, such as improved air quality or similar)
- how revenue recycling works
Ahonen & Palanne (2025) use detailed micro-data from Finland and find that the distribution of fuel costs is
- pretty proportional overall, but regressive on car-owners
- households that are located outside city centers, have children, or include employed people face higher tax burdens.
- differences in income explain very little in the variation of fuel tax burdens
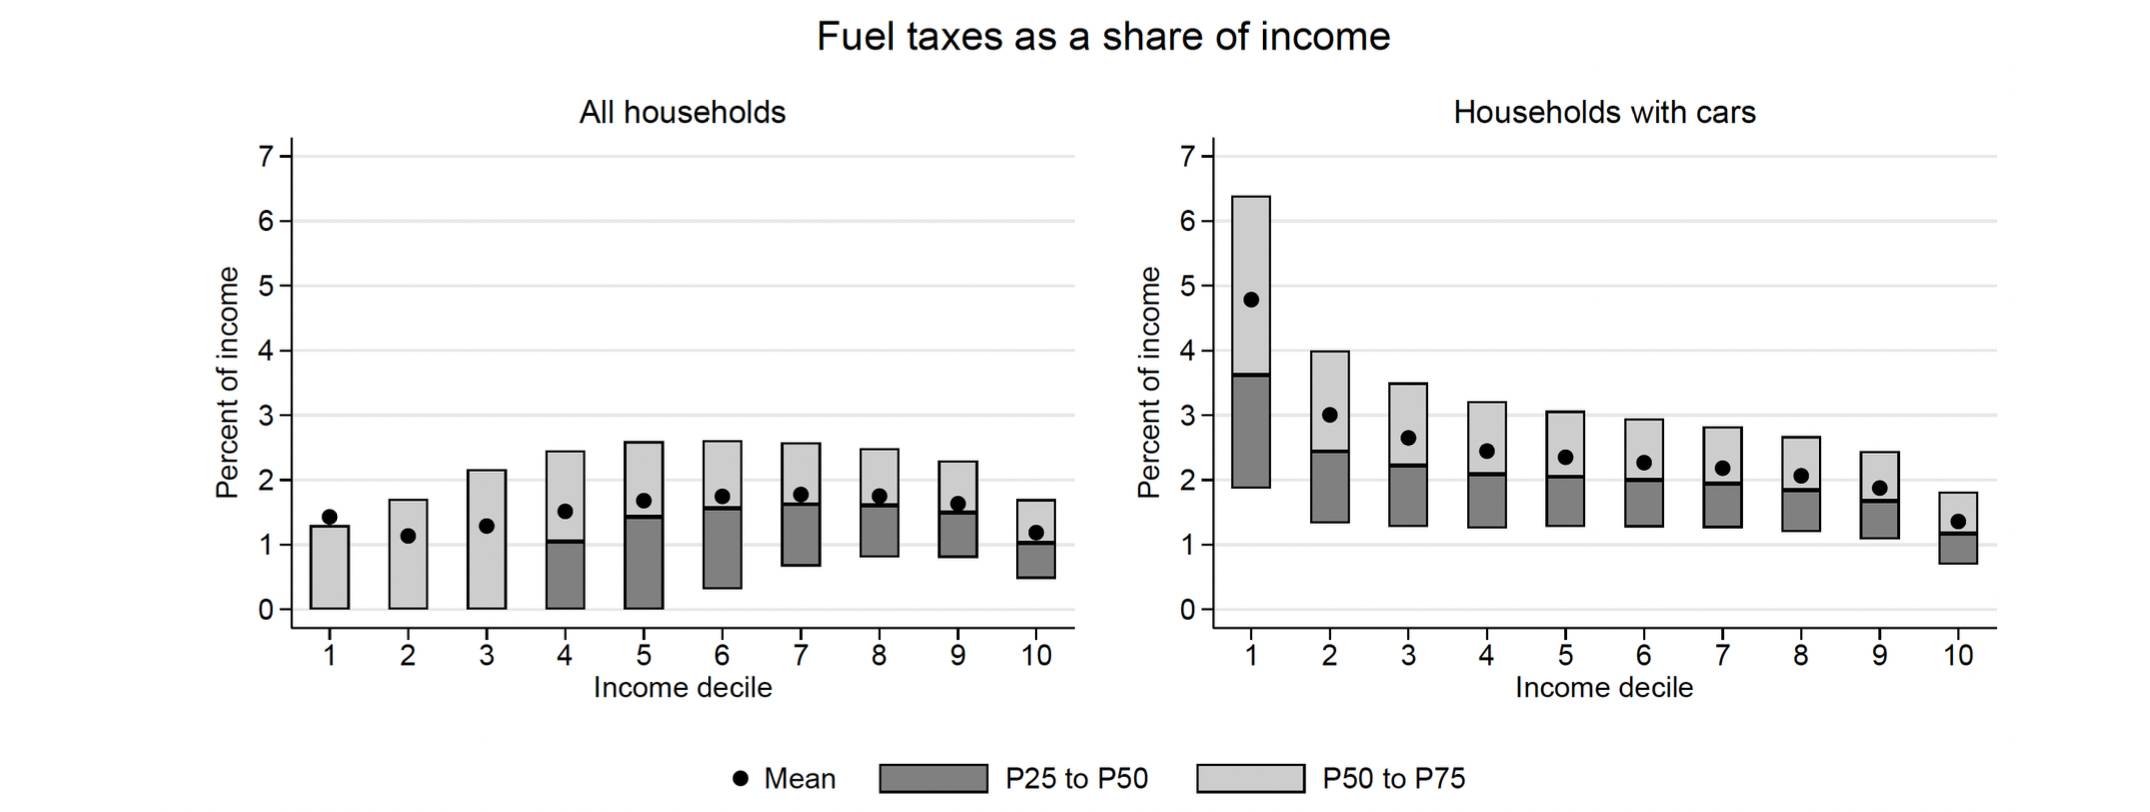
And, in general, we know that poorer households tend to consume more polluting goods relative to their income-
From the firm perspective, some costs will be borne by firms that cannot fully transfer them to the consumers: Cost pass-through rates depend on the specificitiy of the respective markets (e.g. degree of competition):
- close to full pass-through in energy as well as fuel
- limited pass-through in industry
These costs can either hit capital or labor costs:
- capital costs will mainly affect the upper 2-3 income deciles
- labor costs will likely be almost heterogenously distributed
From the benefit perspective, the distribution of avoided climate damages not well quantified within countries.
On the other hand, it is often easy to quantify the geographic distribution of co-benefit within a speciic area.
Finally, we know that if resources (subsidies, tax revenues, or allowances) are redistributed to activities that are emission-intensive , it undermines the goal of reducing emissions (the redistributed resources enable or encourage these high-emission activities to continue or even expand)
Furthermore, lump-sum redistribution without targetint a specific use can also dilute the effectiveness of emission reductions (people may use the funds to engage in activities that increase emissions)
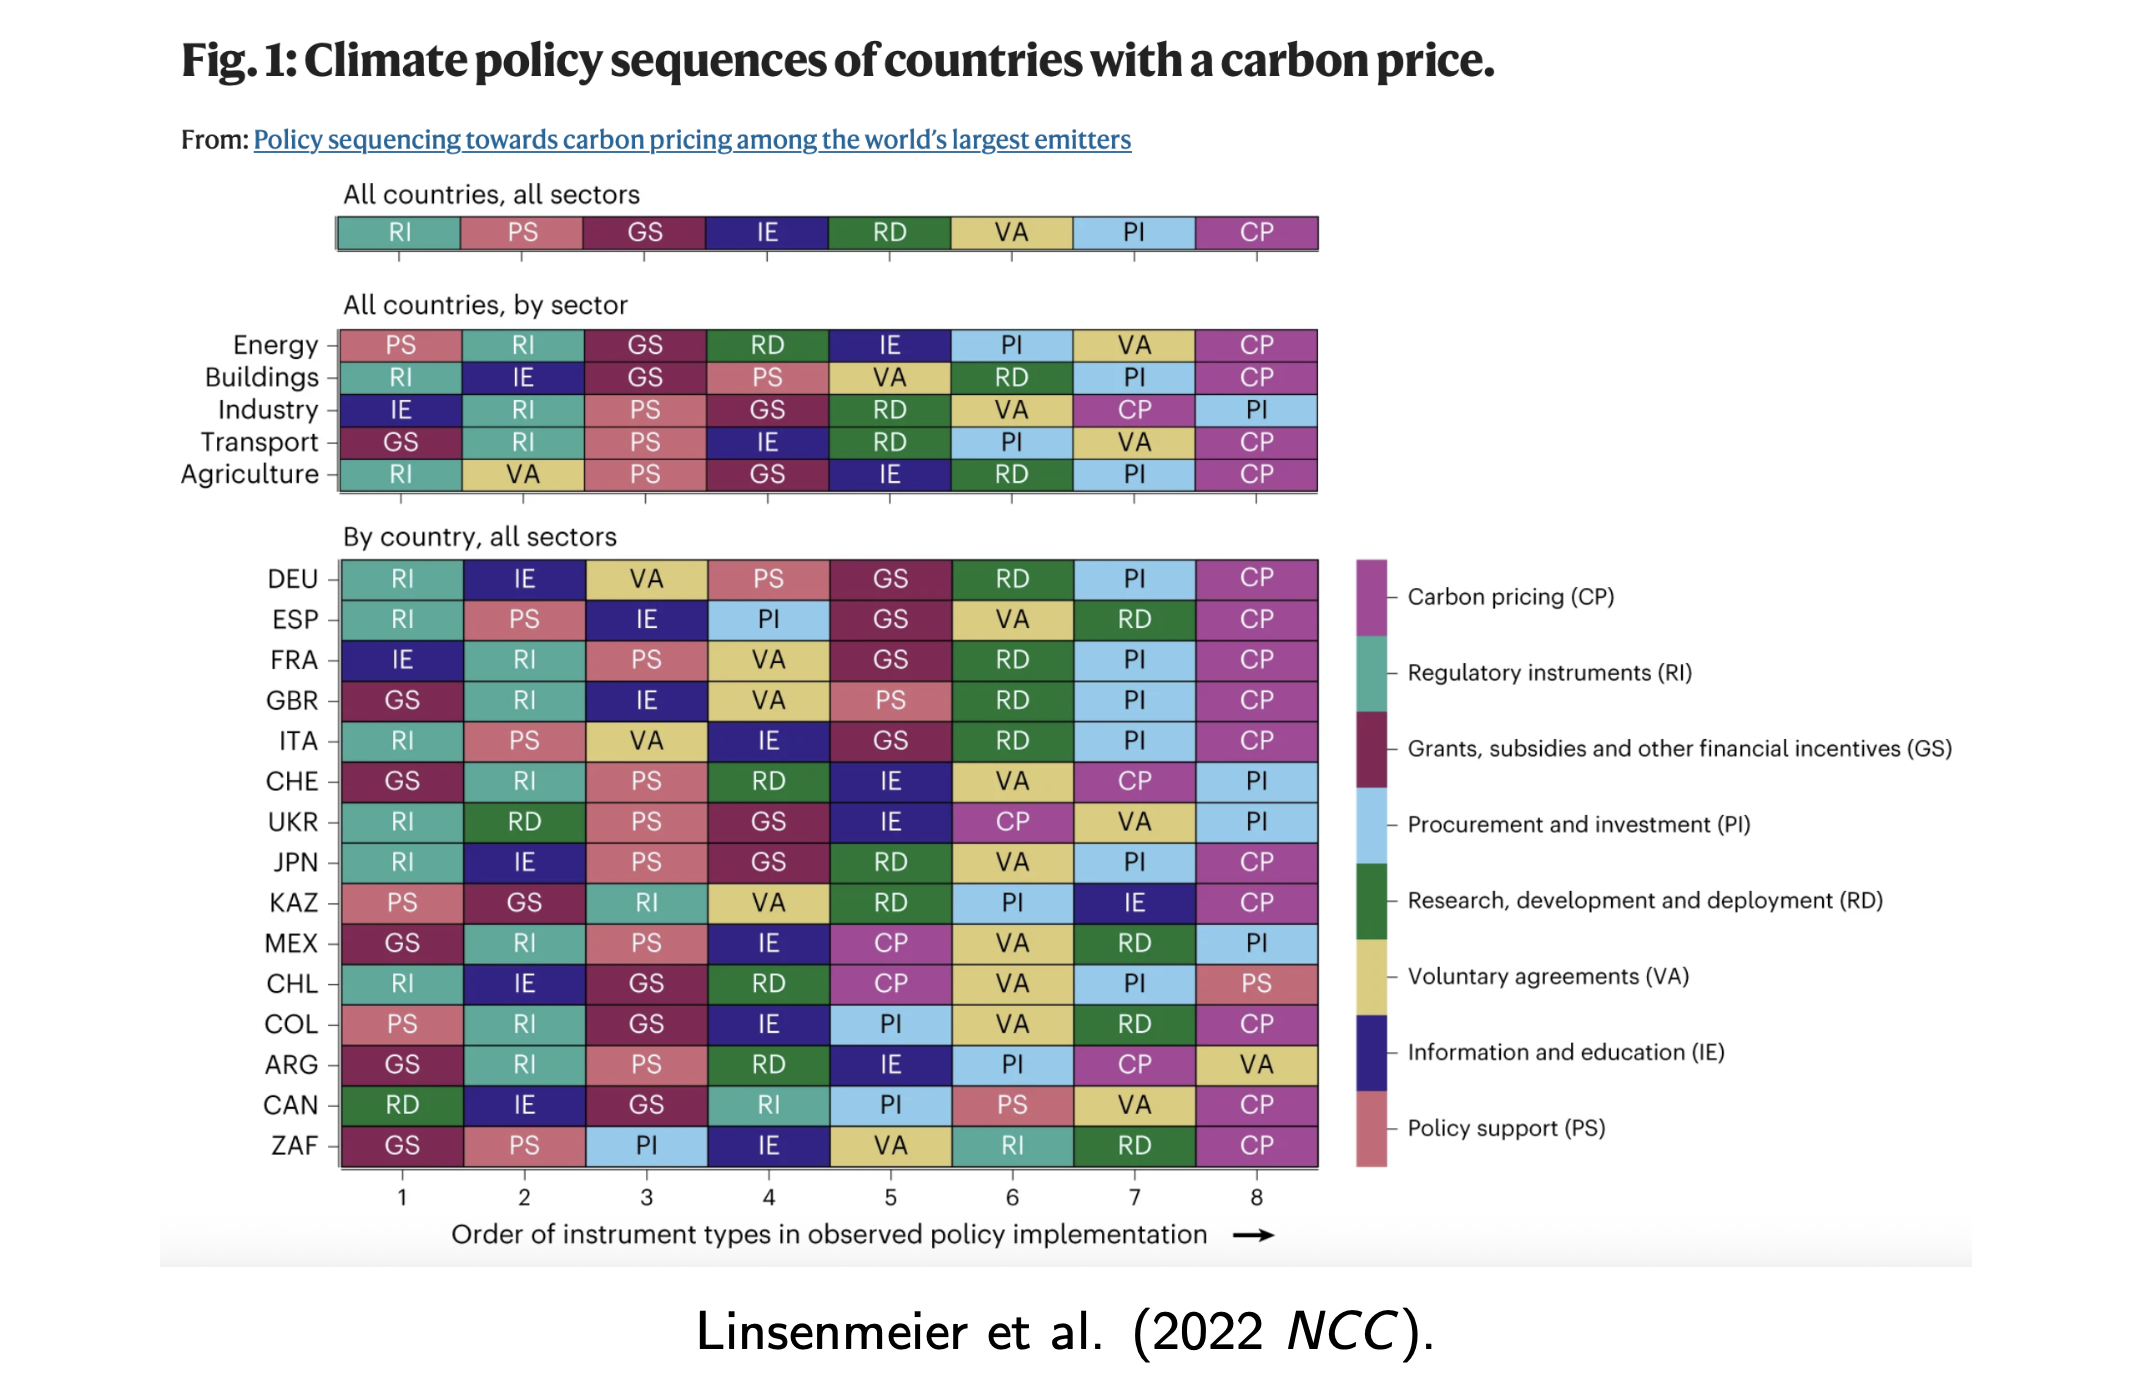
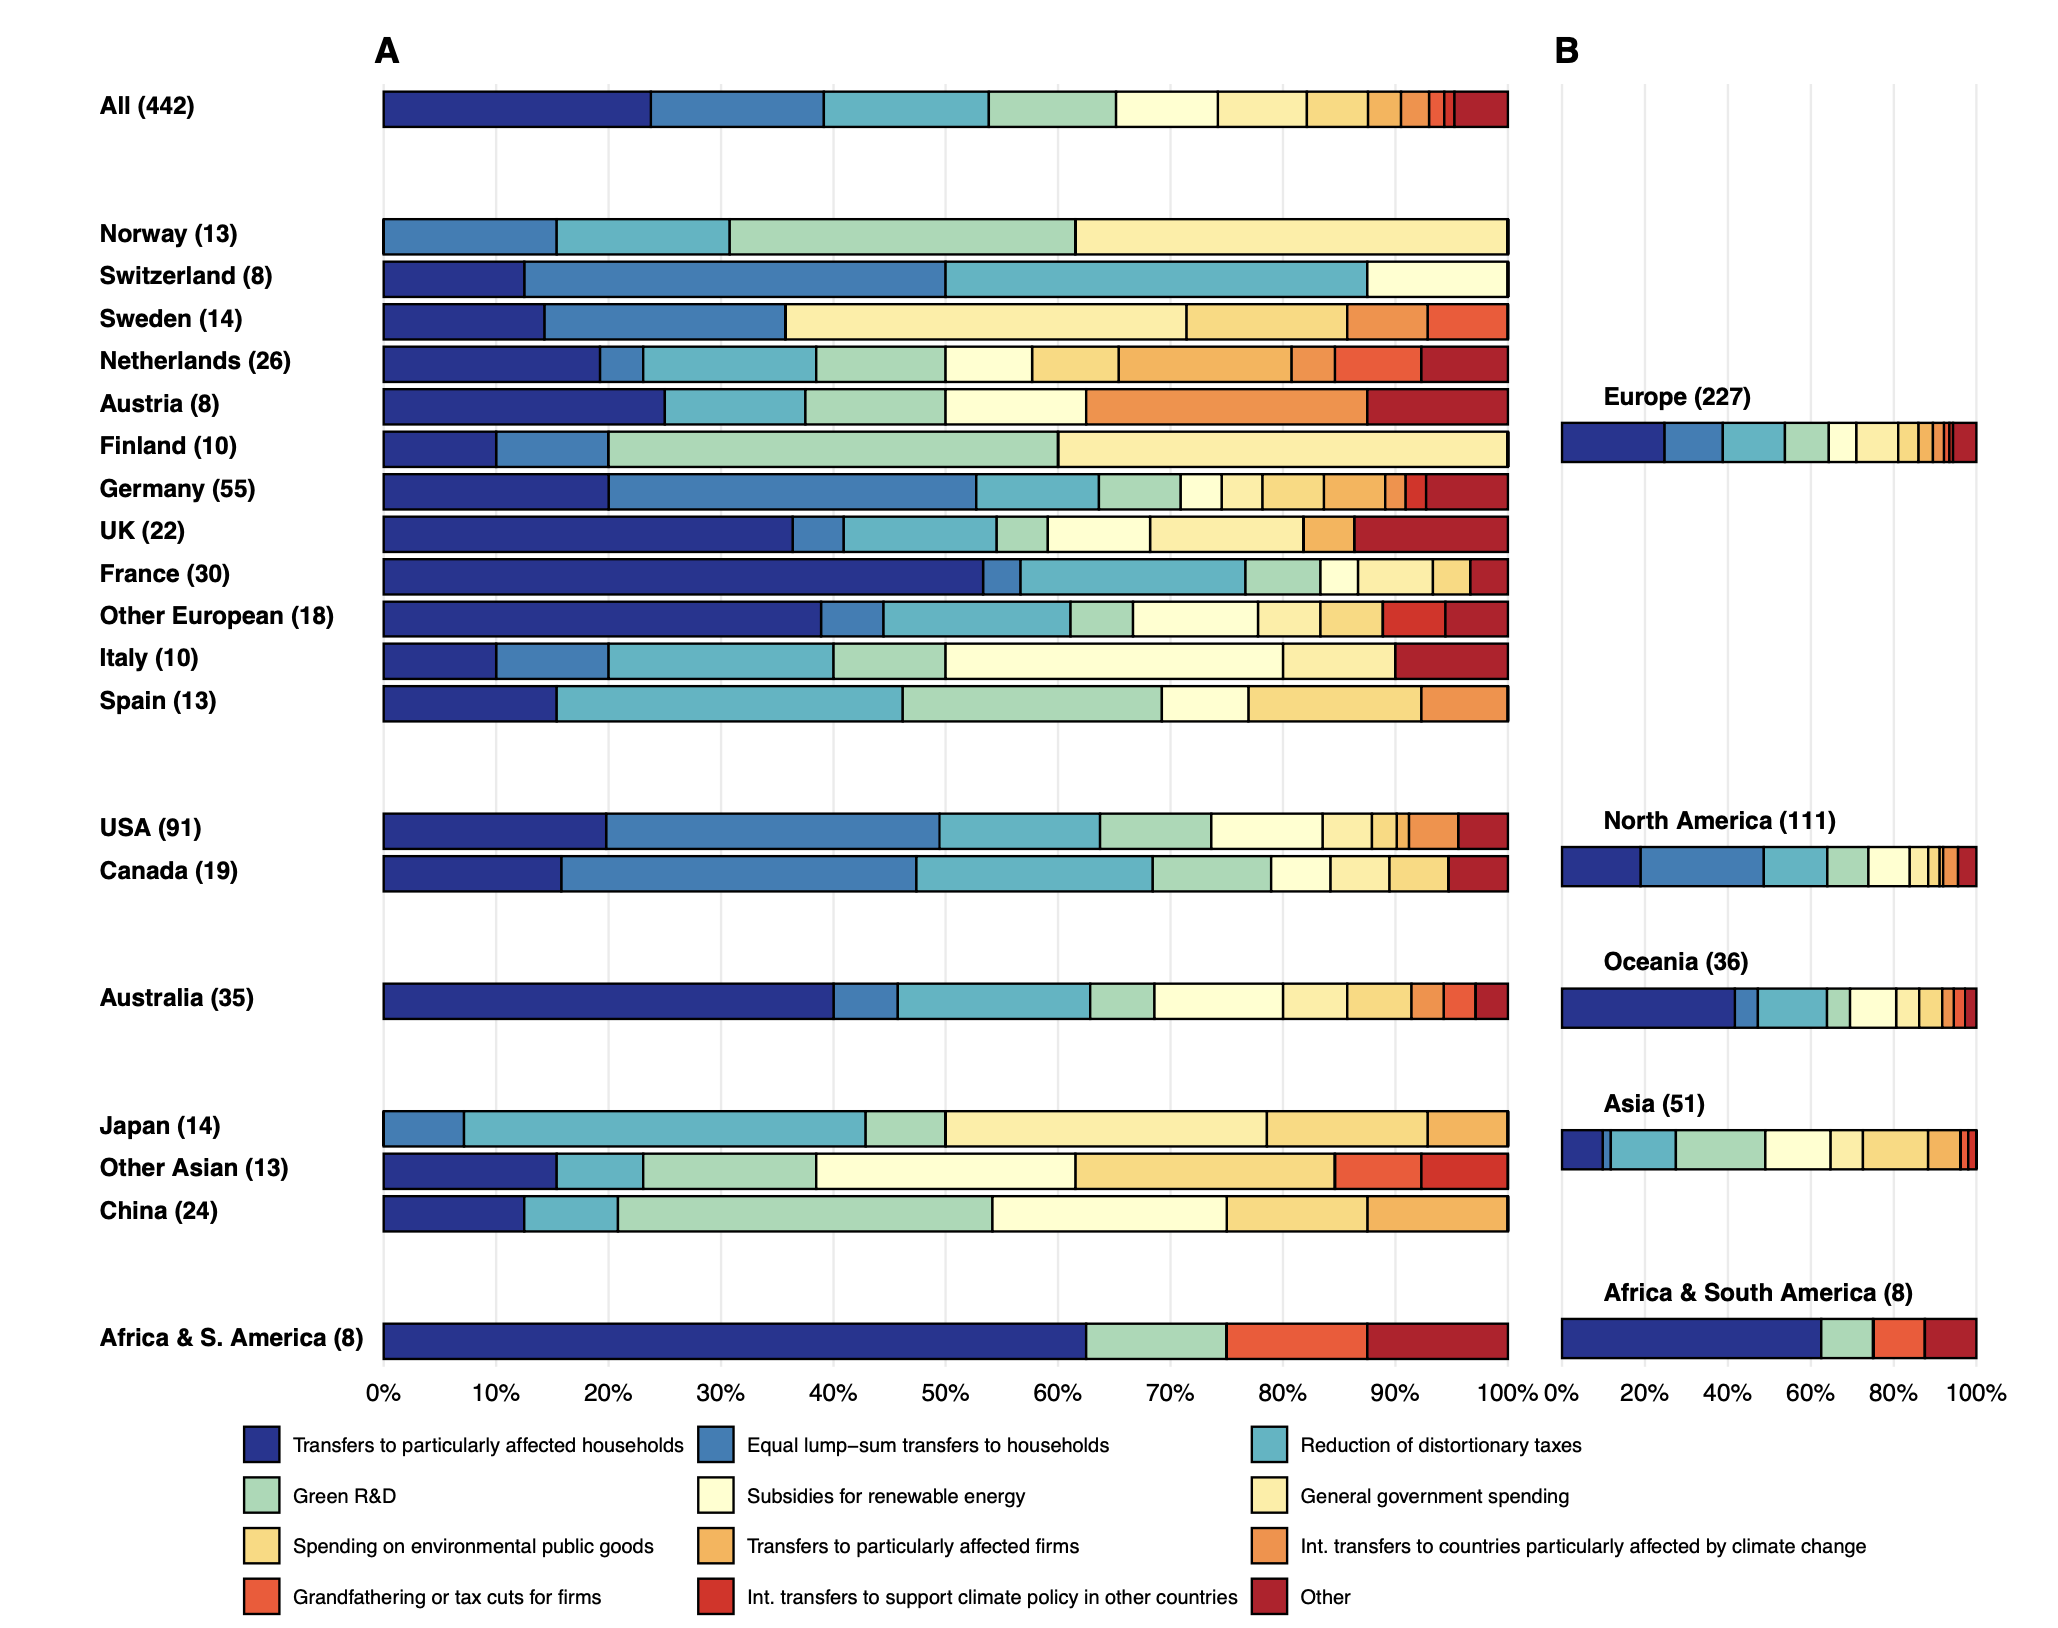
Experts, in general, support carbon pricing as the primary choice, but also proposing different implementations and methods:
- General government spending
- Equal lump-sum transfers to households (“climate dividend”) (15%)
- Transfers to particularly affected households (24%)
- Reduction of distortionary taxes (15%)
- Grandfathering or tax cuts for firms
- Transfers to particularly affected firms
- Spending on environmental public goods
- Green R&D (11%)
- Subsidies for renewable energy
- Transfers to countries particularly affected by climate change
- Transfers to support climate policy in other countries
In Switzerland, there's a building program for energetic retro-fitting and renewing heating systems; implemented with technological support funds to support innovative firms then the money is "redistributed" amongs firms and households
Case: CO2 revenues recycling in AustriaRevnues from CO2 pricing are used to issue a starting 145 Euro base salary bonus paid to all people with residence in Austria. Then the bonus can vary depending on the region:
- +50 Euro in centers with good public transport
- +100 Euro in centers with sufficient public transport
- +150 Euro in rural areas with basic public transport
(There are also some adjustments based on the income-level and some more redistributions flow through tax reduction for families)
Carbon pricing: Distribution and re-distribution
Carbon pricing has several distributional channels. For each of them, we require further research to craft an ideal redistribution scheme.
But we can summarize that carbon pricing is not generally “unfair” in the sense of disproportionally burdening lower-income households
a mix of revenue use is likely the best solution to redistribute effectively and fairly (but this can quickly become too complex for the public since we also have to consider political and acceptabiility aspects)
International (Non) Cooperation
Generally speaking, we cannot expect countries to cooperate on climate change due to:
- free-rider problems
- competition
- global change agreements
- sub-global agreements and climate clubs
- unilateral policies with carbon border adjustment
But we also have to consider that historic contributions to climate change are unequal...
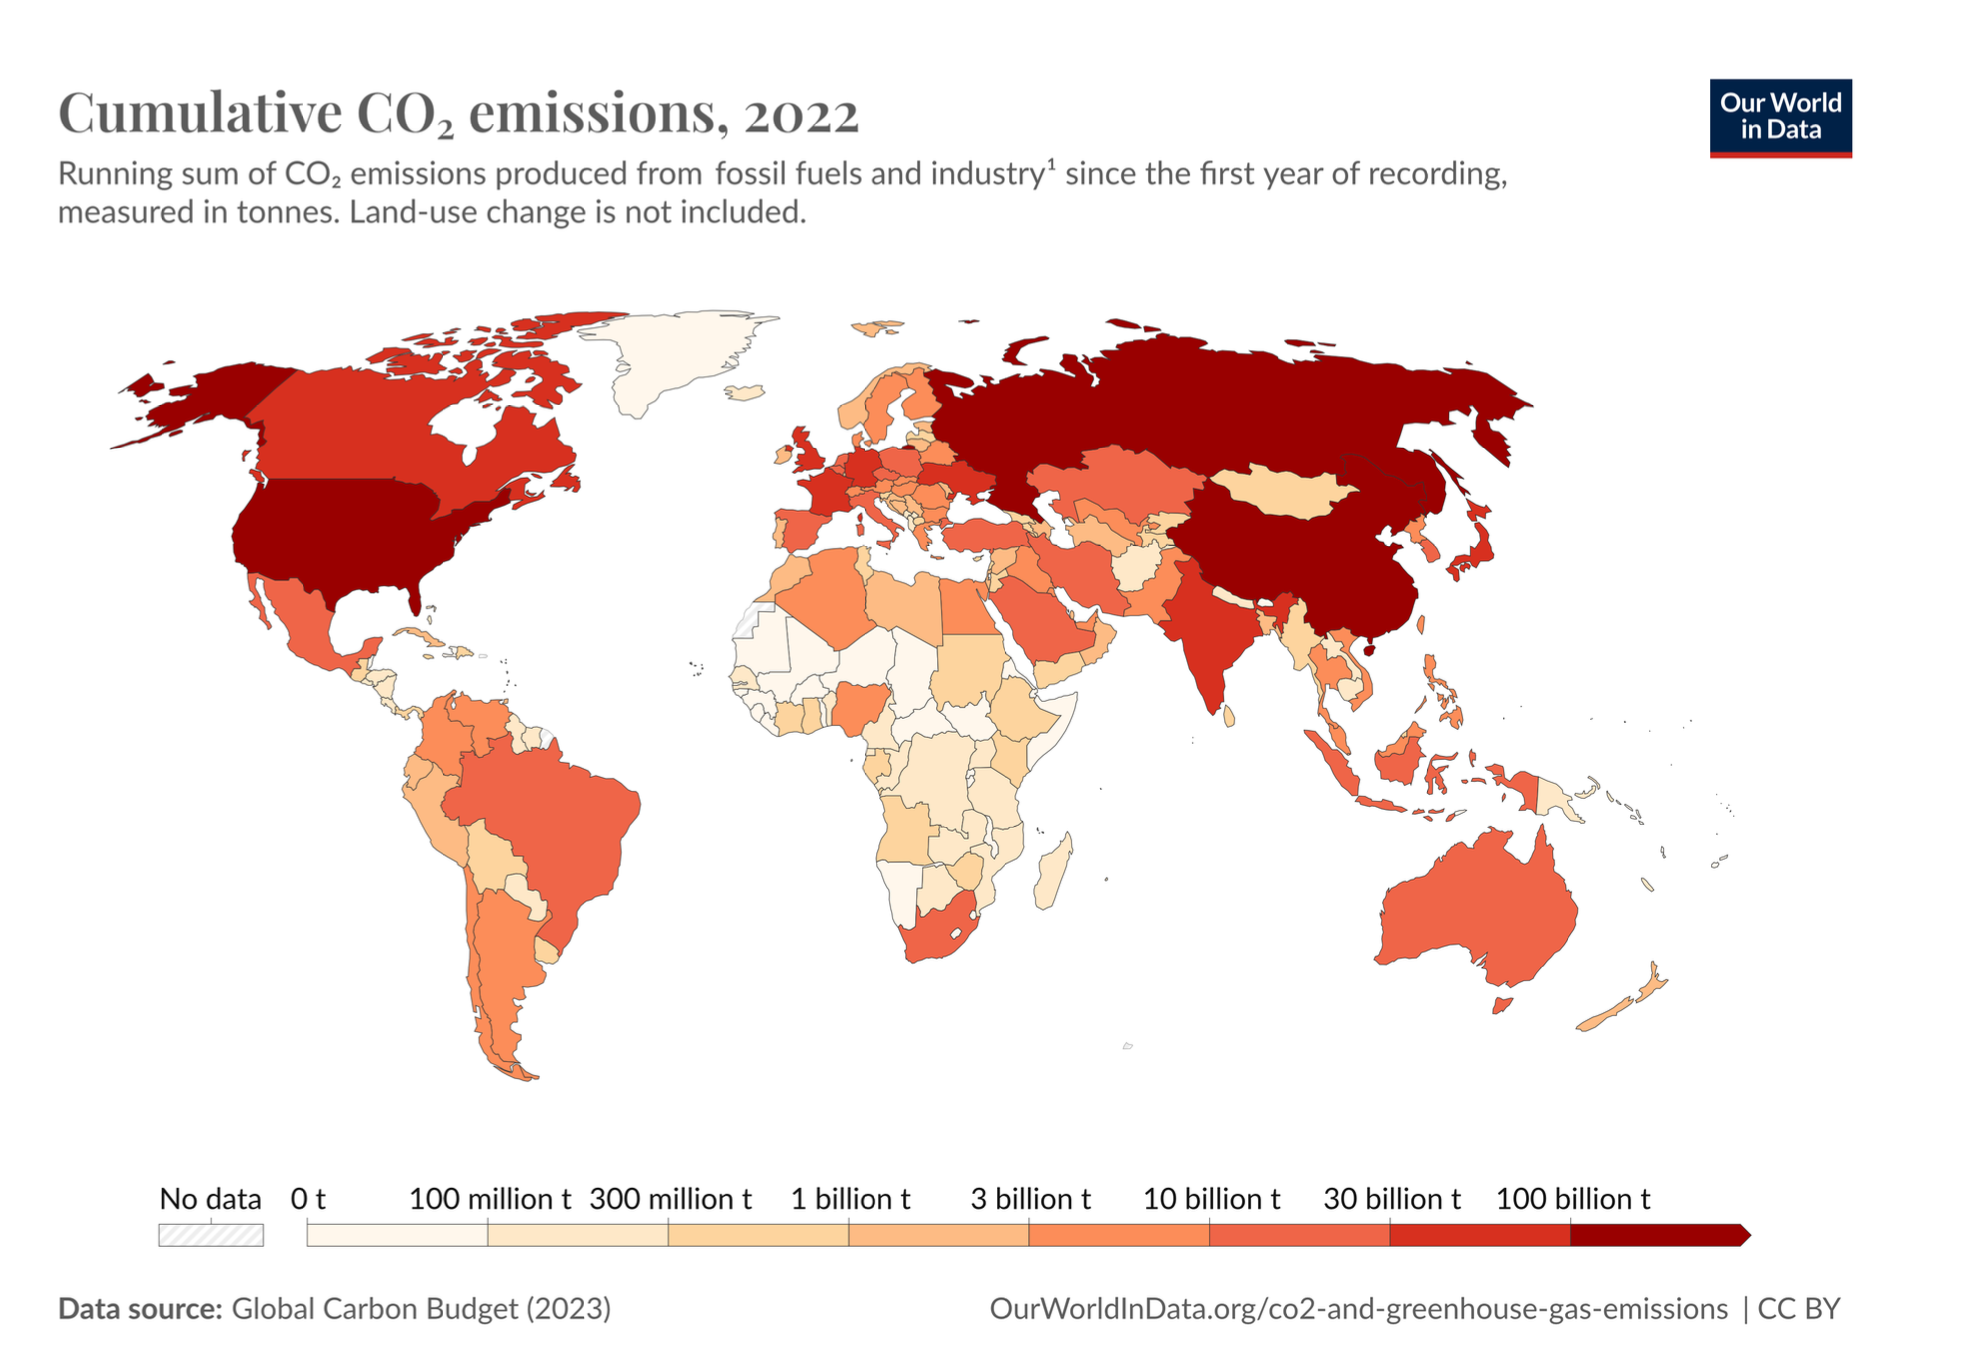
... as well as the climate change damages:
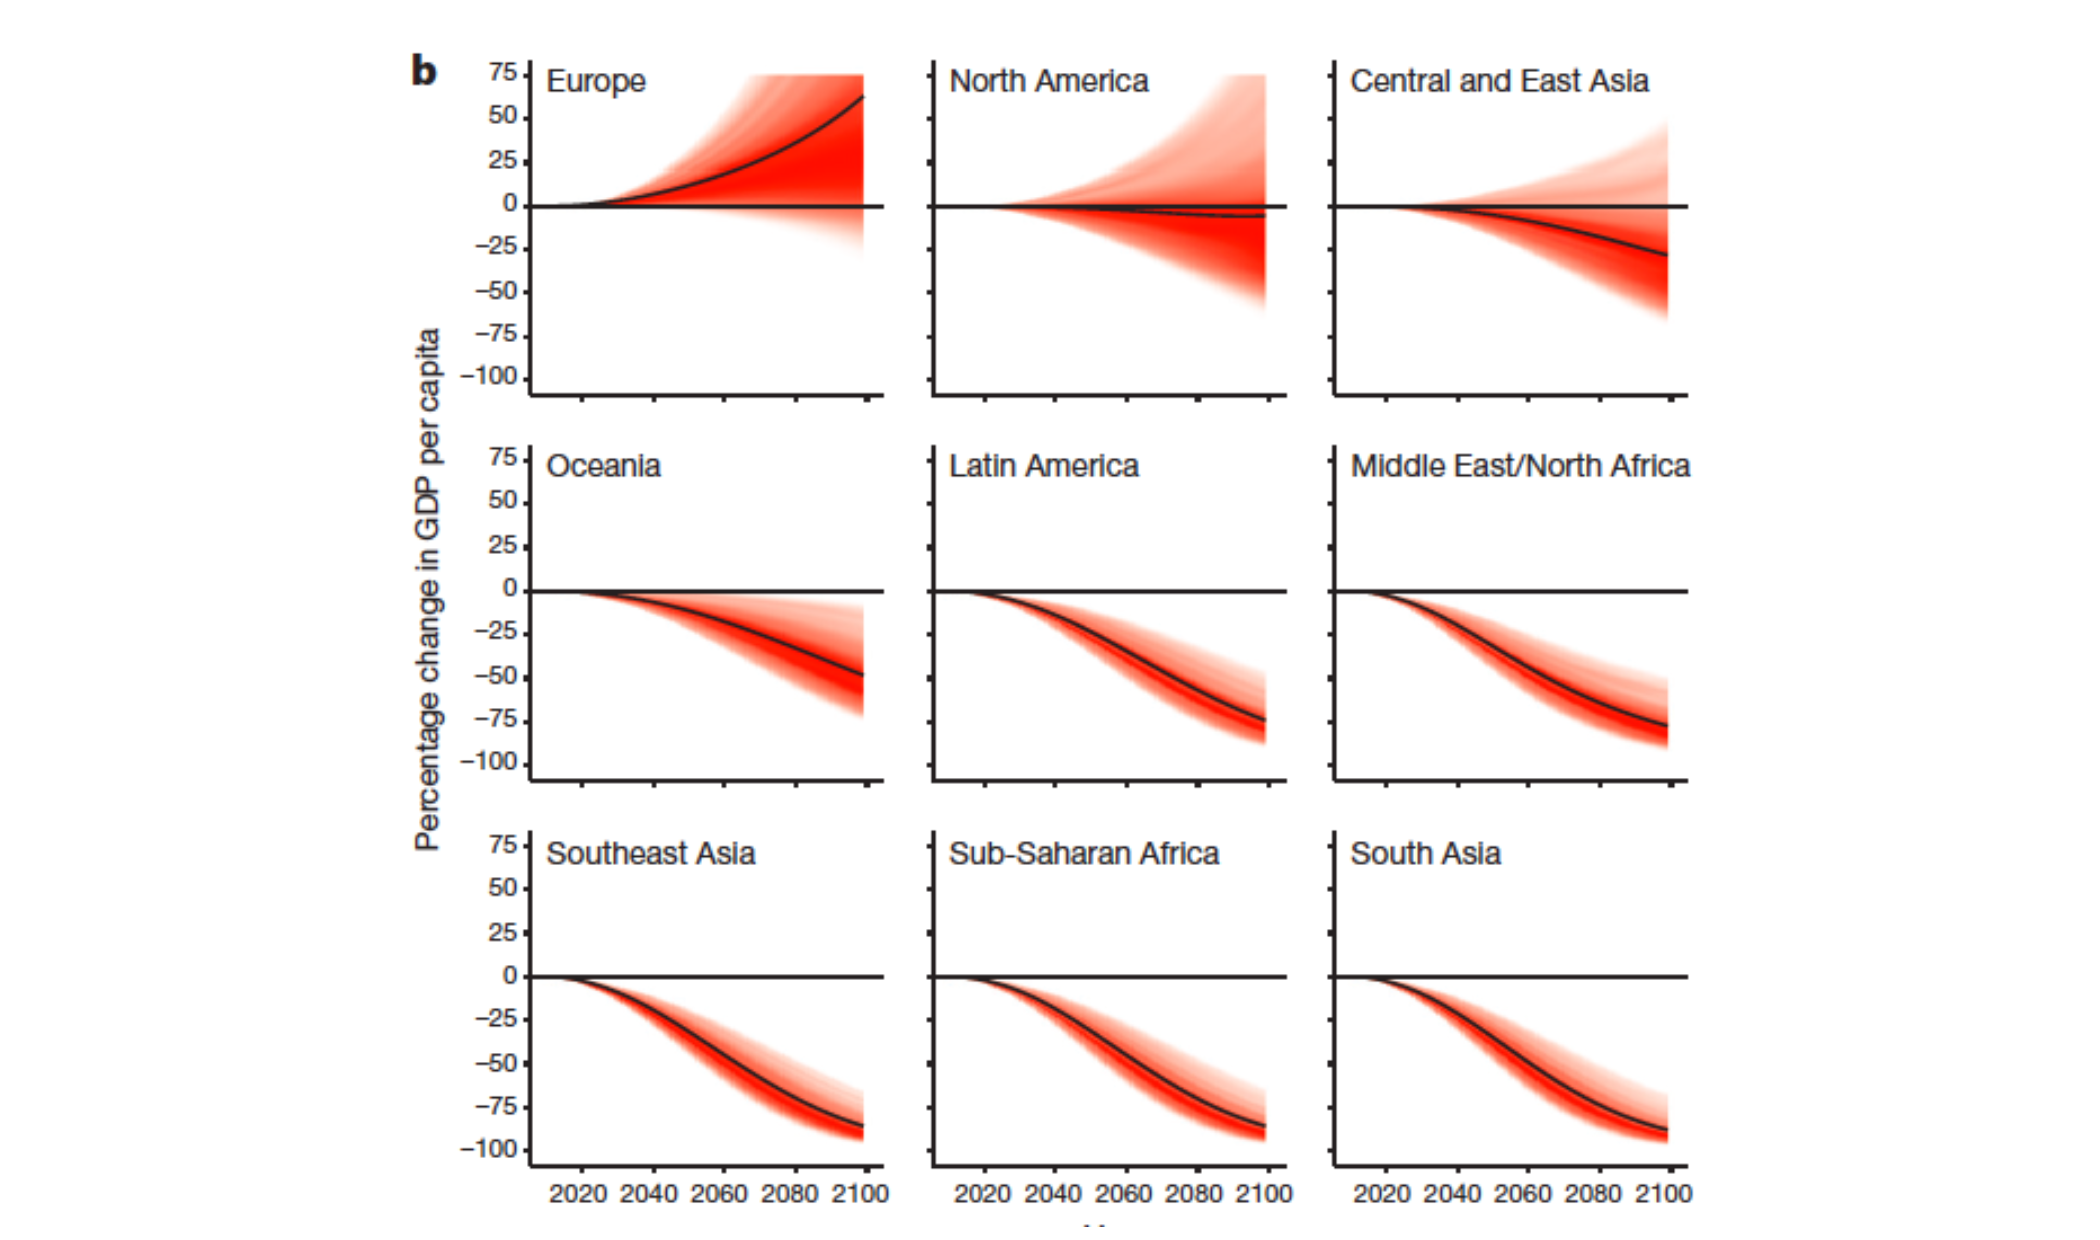
The main problem is that climate change is not only an issue of intergenerational distribution, but the global climate is a global public good and the climate problem cannot be solved by any single country free-rider problem individual countries have (egoistic) benefits from climate change mitigation but they want other countries to take the burden.
We can then identify 4 burden sharing principles:
- The egalitarian rule: All human beings have equal rights in the use of the atmosphere Principle of equal per-capita emission permits
- The sovereignty rule: All countries have a right to use the atmosphere, and current emissions constitute a status quo right Equal percentage reduction of emissions (from status quo)
- The polluter-pays rule: The greater the contribution to the problem, the greater the share of the user in the mitigation/ economic burden Equalize ratio of abatement costs and emissions
- The ability-to-pay rule: The greater the capacity to act or ability to pay, the greater the share in the mitigation/economic burden Equalize ratio of abatement costs and GDP
Some more alternative principles:
- Follow the international negotiation process by looking for some political solution to permit distribution.
- Distribute permits to highest bidder.
- All nations (individuals) should be treated equally equalize net welfare changes across nations (individuals)
- Incorporate responsibility for historic emissions
Current burden sharing policy is mixed:
- strong emphasis on the sovereigntyrule
- some elements of the ability-to-pay rule (to adapt for poorer countries)
- lots of discussion on egalitarian and polluter-pays rules
International Climate Agreements
- Earth Summit 1992:
- Creation of the UN Environment Programme (UNEP)
- UN Framework Convention on Climate Change (UNFCCC)
- Kyoto Protocol (1997) binding commitments for some countries
- Paris Climate Agreement (2015) volontary commitments for all
To understand if international climate change agreements made some changes, Maamoun (2019) used the generalized synthetic control method (GSCM) to generate counterfactual pathways for how emissions would have evolved in industrialized countries (with binding reduction targets) with a weighted combination of other countries that did not have binding reduction targets:
Nordhaus proposes regimes with small trade penalties on non-participants: this may induce a large stable coalition with high levels of abatement. This can be achieved in 4 steps:
- pepole around the world must understand this problem. those who understand the issue must speak up and convince the contrarians to take action too.
- nations must establish policies that raise the price of CO2.
- countries have to make sure that actions are global and not local the most efficient way is through climate clubs
- rapid technological change is central to the transition to a low-carbon economy, and needs to be supported by governments.
Based on economic theory and modeling, Nordhaus (2015) finds that without sanctions against non-participants there are no stable coalitions other than those with minimal abatement. By contrast, a regime with small trade penalties on non-participants, a Climate Club, can induce a large stable coalition with high levels of abatement.
A climate club is defined as a voluntary group deriving mutual benefits from sharing the costs of producing an activity that has public-good characteristics.
Successful clubs often show that:
- there's public good that can be shared among the members
- cooperation and shared duties are beneficial for all the members
- non-members (excluded or external) can be easily penalized at very low cost for members
- membership should be stable the club creates a strategic situation in which countries acting in their self-interest will choose to enter the club and undertake high levels of emissions reductions.
Note that, even if Europe has a sort of common CO2 pricing, it should not be considered a climate club since it's missing penalities for non-members.
13. Collapse, Resilience and the Sustainable Management of Common Pool Resources
Classification of goods and commons| Excludable | Nonexcludable | |
|---|---|---|
| Rival | Pure private goods | |
| Most nonrenewable natural resources | ||
| (Fossil fuels & minerals) | ||
| Some privatized renewable resources | ||
| (Aquaculture) | Renewable natural resources | |
| characterized by open access | ||
| (Ocean fishing) | ||
| Some nonrenewable resources | ||
| (Ogallala Aquifer) | ||
| Nonrival | Club goods | |
| (Water quality of municipal pond) | Pure public goods | |
| (Clean air, greenhouse gases | ||
| and climate change) |
The key difference is rivalry in resource use/consumption:
- behavioral differences can be studied and inllustraded in laboratory experiments
- in their canonical form, both games are finitely repeated, so they are multi-period, multi-person social dilemma games hard to replicate in the lab.
The pure public good VCM game
Agents can voluntarily invest in their prevision, no agent ca be excluded from enjoying the public good benefits.
Benefits are alinear function of the subjects's contribution:
aggregate payoffs are maximized if each one invests her entire wealth/effort in the public good.
On the other hand, the single (own)-payoff maximizing strategy is pocket (get from himself) nthe one's endowment independent of the amount contributed by others.
contributing 0 to the public good is a dominant strategy if:
- all agents only care about their own private payoffs
- this is common knowledge
In contrast, experiments show that, on average, 40-60% of people's endowment is invested in the first period but, over time, contributions decline to zero in the last period.
The Common Pool Resource (CPR) game in the labAgents can extract from a common pool and the benefits of doing it are decreasing function of the extraction levels chosen (from the aggregate, not the individual).
The CPR is a non-linear Public Bad Game and cooperation typicall disappears quickly.
Aggregate extraction typically starts closely to the social optimal, then it quickly converses to the Nash Equilibrium, indepdently of the number of periods.
The lack of cooperation in the CPR game may be done due to the facrt that some can undo the good works of others, intead in the VCM game the worst a freerider can do is nothing.
Comparing the share of Cooperators in the VCM and CPR games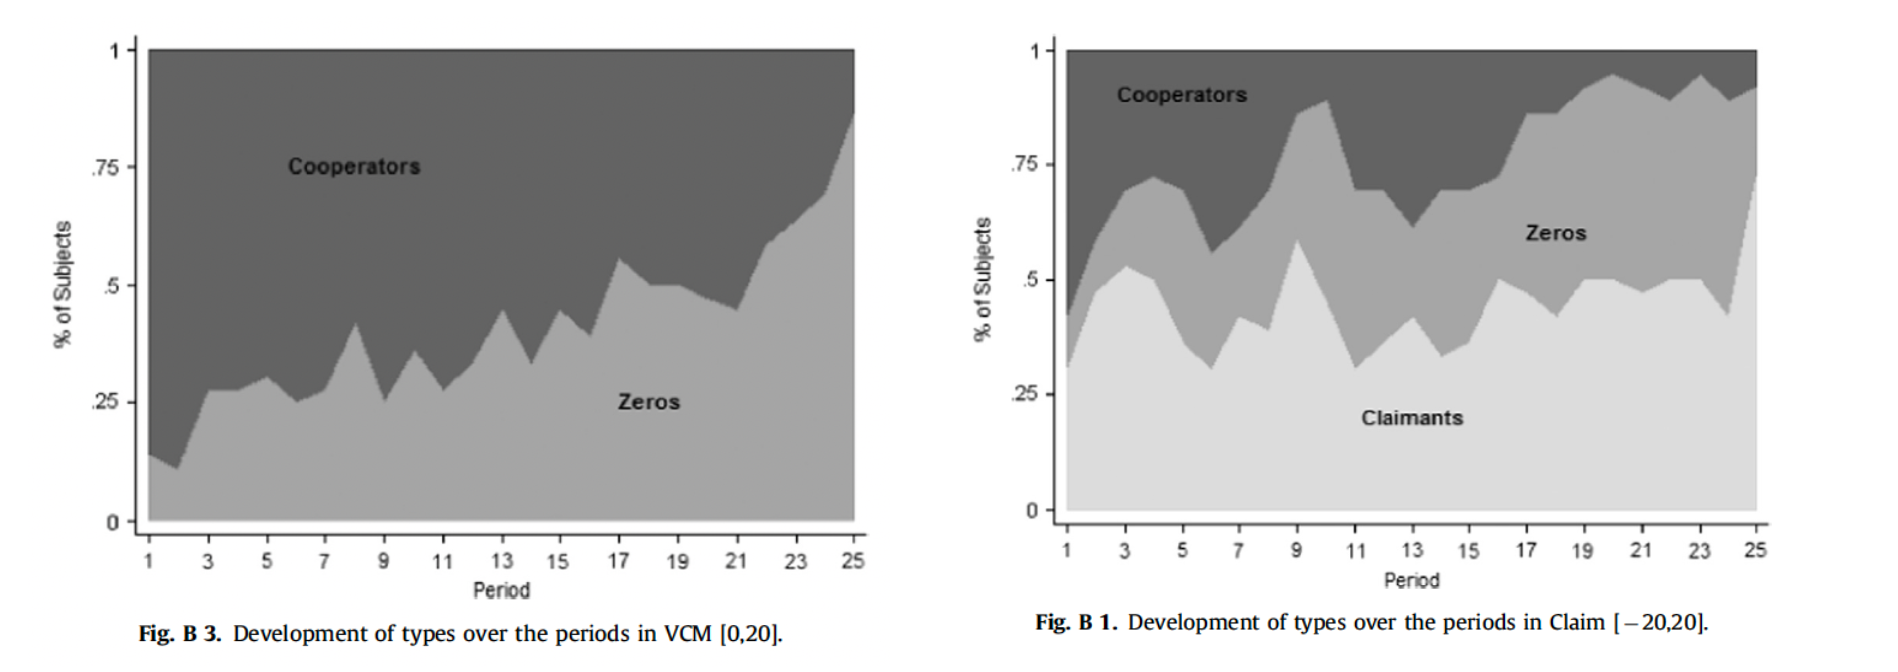
In generally, allowing subjects to undo the contributions of others results in:
- aggregate contribution that are not significantly different from zero in all the periods
- immediate collapse of cooperation
Aspects missing in a simple Claim/CPR lab game
Facilitating cooperation:
- communication
- non-anonymity/reputation
- social norms
- leadership/coordination
- enforcement mechanism/punishment option
Hindering cooperation:
- much larger of users
- asymmetry/heterogeneity
- uncertainty
- time delays of the benefits
- positional consumption/competition
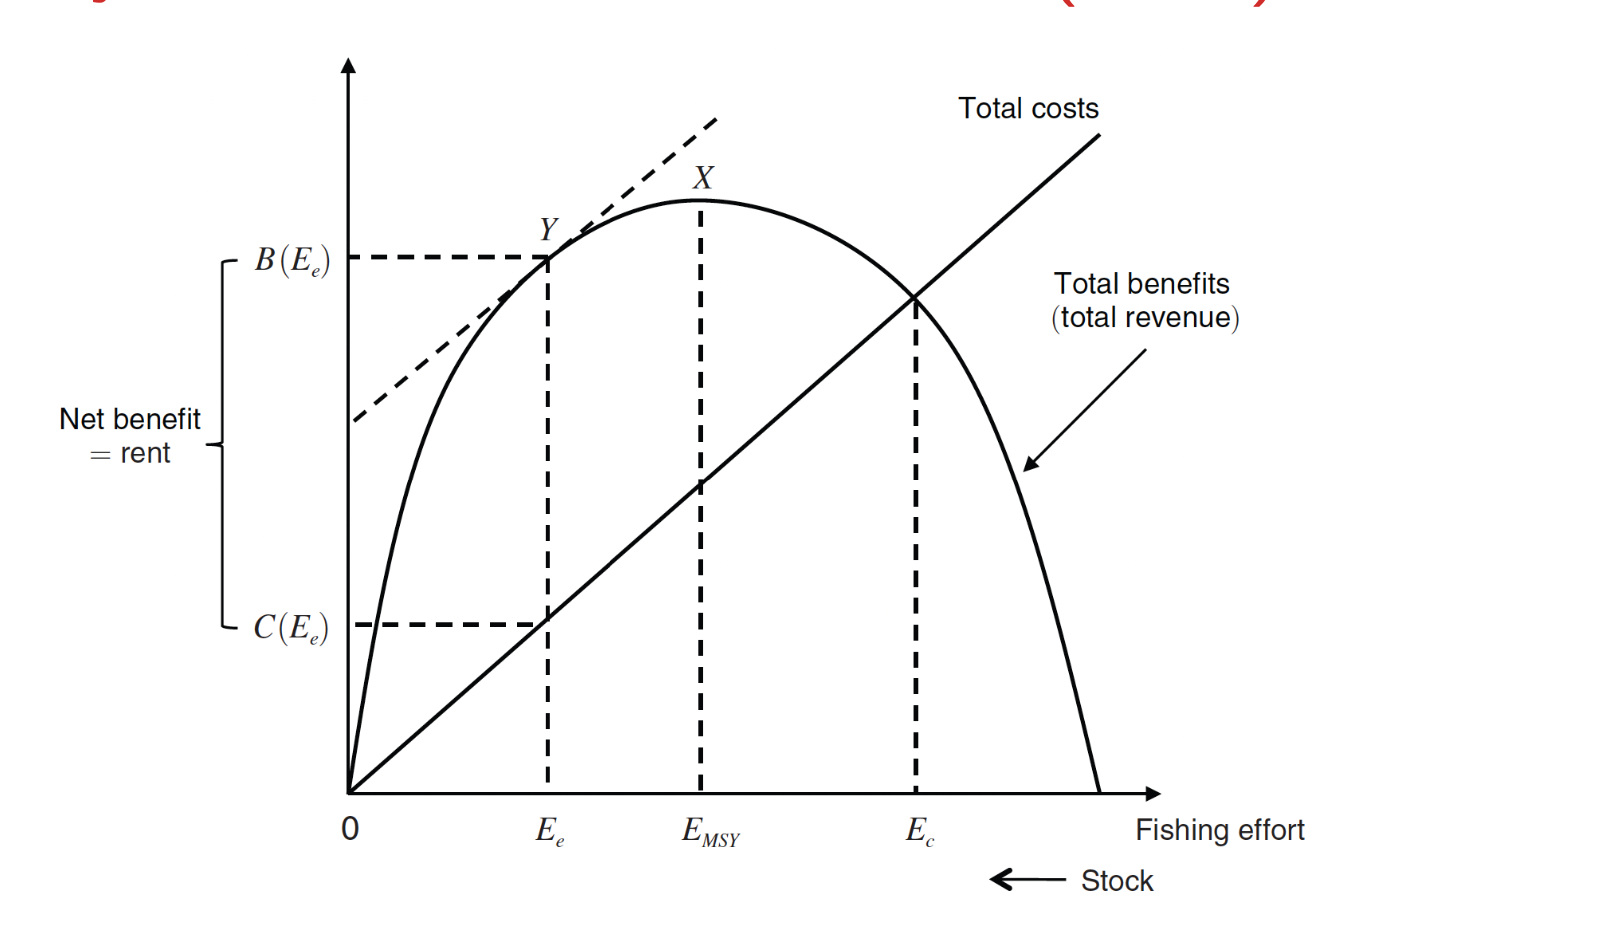
Example: the simple fishery economics, from Stavins (2011)
The efficient outcome occurs at where (marginal benefit equals marginal cost).
This point generally differs from the maximum sustainable yield (MSY): MSY maximizes biological harvest, while maximizes economic surplus once fishing costs are included.
For this reason, the efficient outcome typically implies lower fishing effort than .
If we consider a competitive open-access equilibrium, this occurs at , where marginal benefit equals average cost.
At , individual fishers ignore the future value of the stock (the shadow price of the resource is effectively ), so entry continues until economic rents are dissipated.
The Tragedy of the commons
Open access to resources may lead to over-use (example: overfishing), sometimes called "tragedy of commons".
This is, however, an oversimplification: commons can be managed sustainably, depending on institutions, governance quality, and property rights.
Elinor Ostrom (Nobel Prize in Economics, 2009) identified 8 core design principles associated with long-enduring commons governance:
- Clearly defined boundaries: users and resource boundaries are explicit.
- Congruence with local conditions: appropriation and provision rules fit local ecological and social realities.
- Collective-choice arrangements: most affected users can participate in modifying the rules.
- Monitoring: resource conditions and user behvior are monitored by accountable monitors.
- Graduated sanctions: rule violations are penalized with sanctions that escalate with severity and repetition.
- Conflict-resolution mechanisms: low-cost, accessible arenas exist to resolve disputes quickly.
- Minimal recognition of rights to organize: external authorities do not undermine users' right to self-organize.
- Nested enterprises: in larger systems, governance is organized in multiple, coordinated layers.
In general, we can distinguish 4 commons management, depending on property and use rights:
- open access (absence of property rights)
- group property (defined by Ostrom, resources rights are held by a group who can exclude others)
- individual property (resource rights are held by individiduals who can exclude others)
- government property (the government holds and regulates the use)
COllapse (Diamond 2005)- consted popoular science
Diamond uses a loose "framework" when considering the collpase of society (defined as the conflict between the short-term interest of those in power and the long-term interests of the society), explained by 5 factors:
- enviromental damage
- climate damage
- hostile neighbors
- loss of trading partners
- society's responses to its enviromental problems
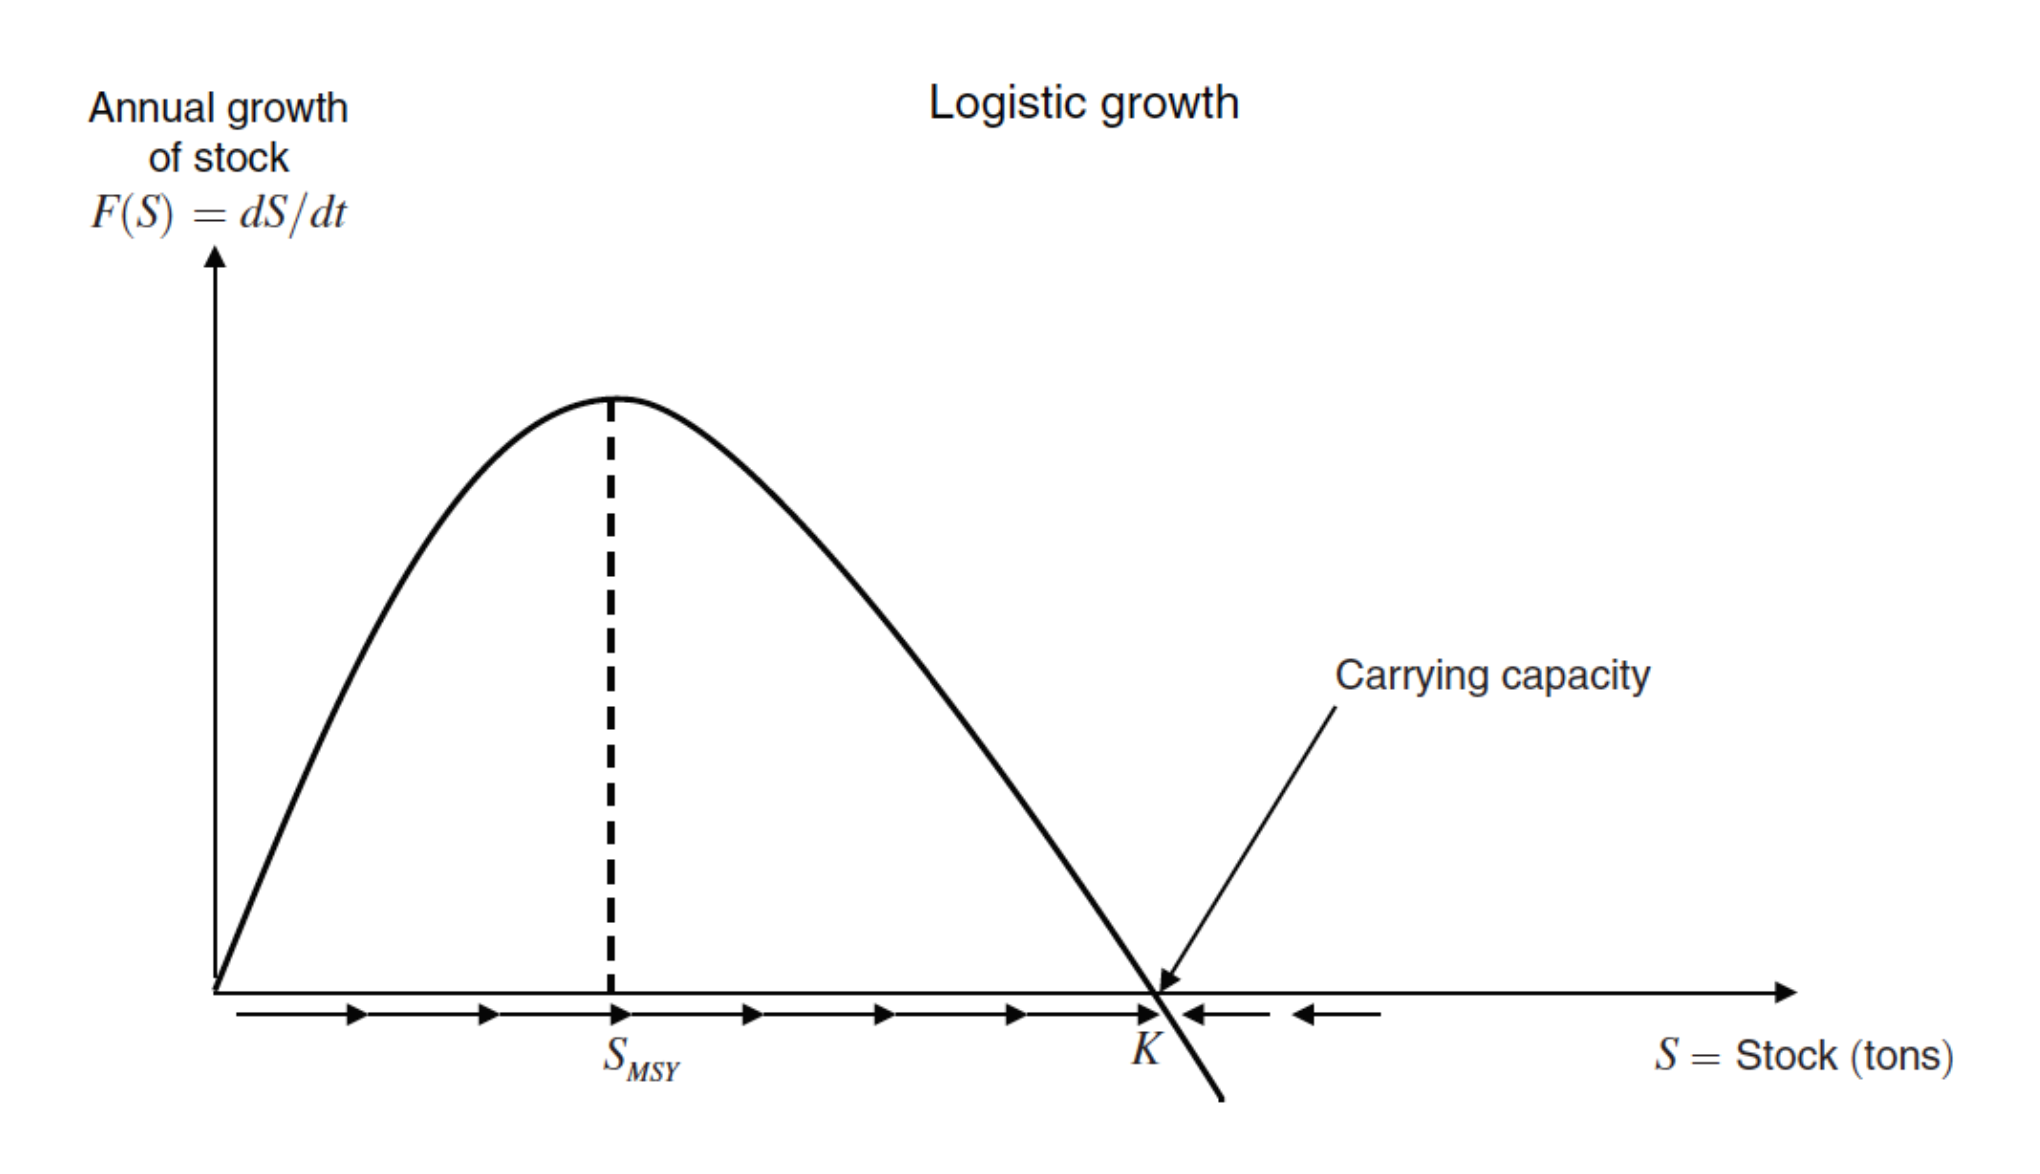
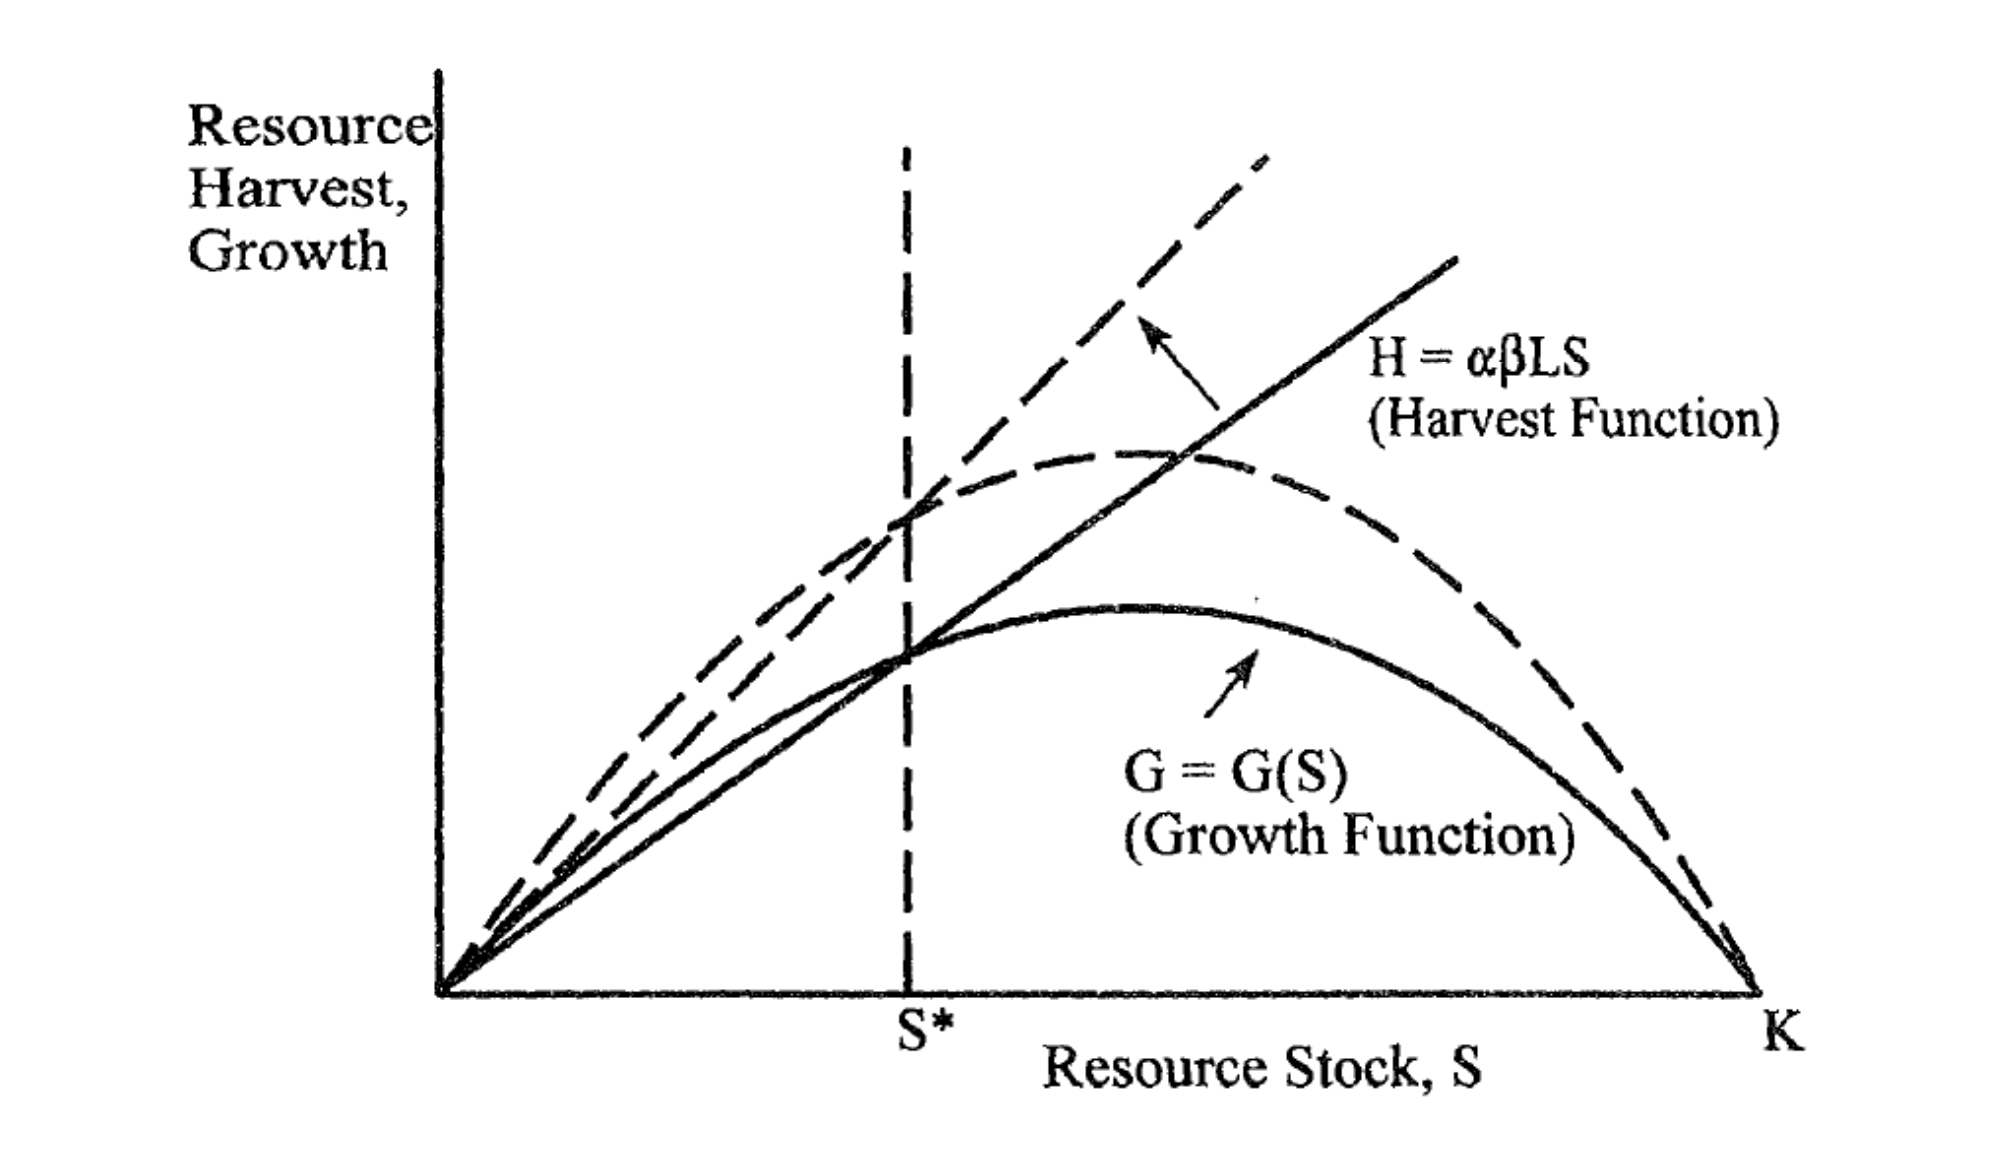
The model relies on a simple renewable resource model:
This is very similar to the equations in Brander and Taylor model for where is forest and soil. Combined, they give:
where is the carrying capacity (maximum possible resource stock) and is the "intrisic" growth (regeneratoin) rate.
where
- : stock of the renewable resource (on Easter Island: forests and soil)
- : harvest rate (annual extraction)
- : intrinsic growth rate (how fast the resource regenerates in the absence of harvesting)
- : carrying capacity (the maximum stock the environment can sustain indefinitely)
- : time
The idea is the logistic growth term that represents how fast the resource grows. When is small relative to , growth is approximately (fast). But as approaches , the term goes to zero, so growth slows down. (This is realistic: forests grow quickly when space and resources are abundant, but slower when they become crowded.)
The equilibrium condition (where the stock remains stable) occurs when harvest equals growth: maximum sustainable yield (MSY).
On Easter Island, initial overharvesting of forests (high relative to available growth) caused the stock to decline. As forests disappeared, the carrying capacity itself decreased, reducing future growth capacity. This creates a collapse dynamic: overharvesting in one period reduces the stock available for future periods, which further reduces growth capacity, making it impossible to sustain modest harvests, so the society faced an impossible choice: reduce consumption or watch resource collapse.
In the model, the economy produced and consumes two goods:
- is the harvest of the renewable resource
- is the aggregate of the other good
Aside from the resource stock , the only other factor of production is labor with a Cobb-Douglas utility function: .
Harvest depends on both resource stock and labor size: .
Now we add a "malthusian" population dynamics that with:
- proportional birth rate
- proportional deadh rate
So the population increases by and it is assumed to be negative, implyling that without any forest stock or soil the population would disappear.
However, the resource consumption increases fertility and decrease mortatlity, so this increases the populatio growth rate:
where is the fertility function.
higher pro-capita consumption of the resource good leads to higher population growth, leading to cyclical dynamics:
Furthermore, after the initial population builds up with abudant resources, population collapses too much:
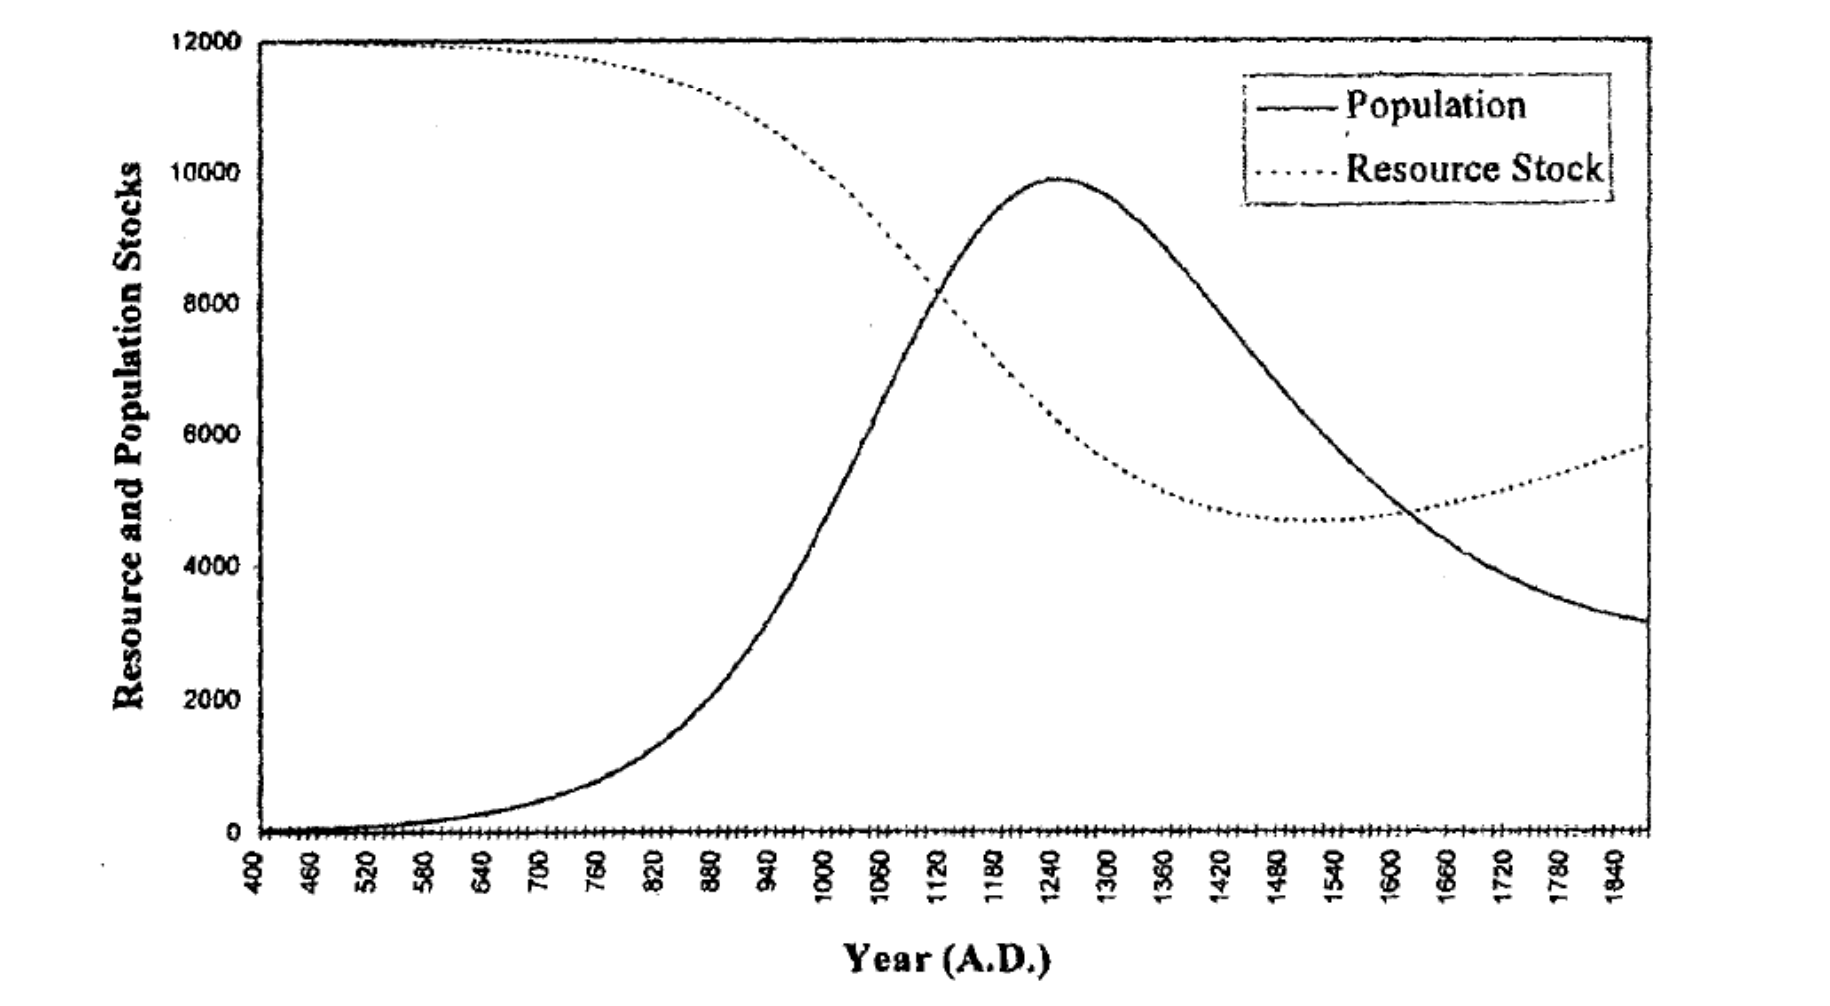
Furthermore, after the initial population builds up with abudant resources, population collapses too much:
However, note that this model may be inaccurate for (at least) two reasons:
- biology (there may be a minimum viable population below with the stock of renewable resource cannot recover)
- preferences (subsistence needs in consumption)
Resilience
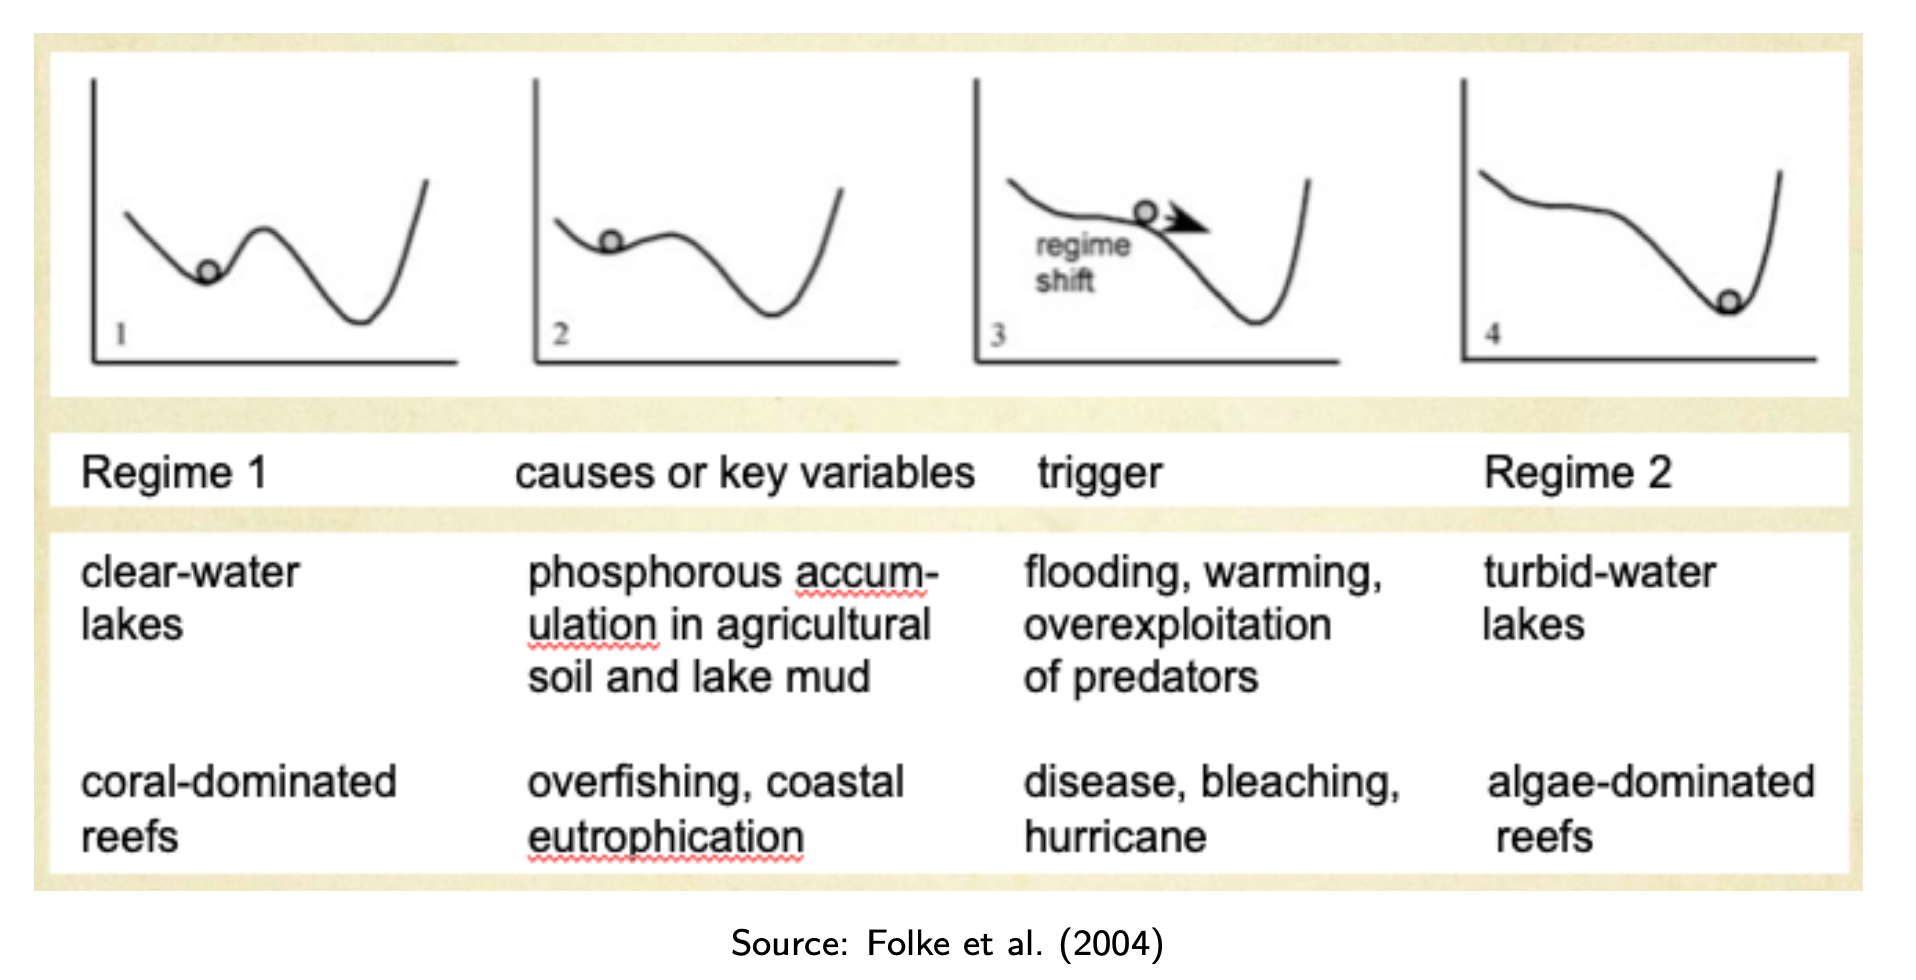
The omnipresent case: a system in equilibrium
A system has one single and stable equilibrium (good state of the system).
However, there are systems with (at least) two potential equilibria, each of them is locally stable.
Resilience is the "amount of disturbance an ecosystem can absorb without changing its basic structure".
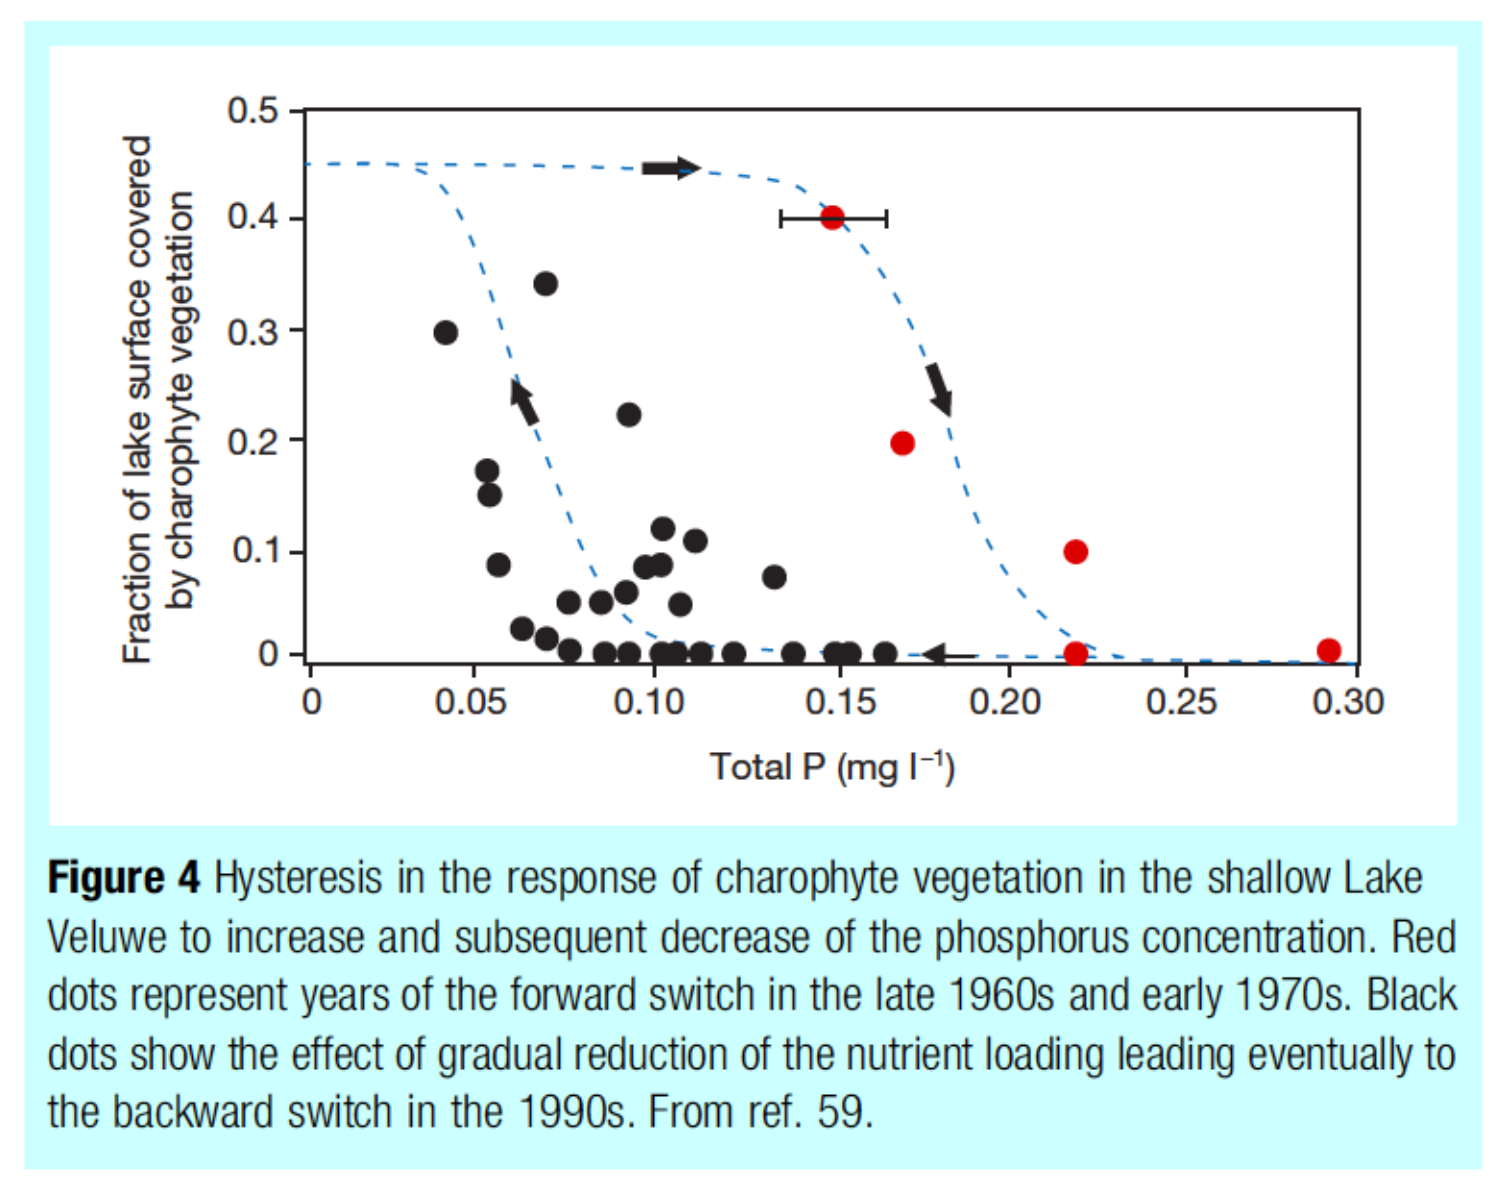
Note that resilience should not be confused with hysteresis!
- Specified resilience: refers to a specific system, to a specifc performance/service in response to a specific disturbance
- General resilience refers to all system, services and performances in response to all disturbances.
Resilience can be interpred as a stock equal to the distance of the current driver condition to the tipping pointa from state 1 to state 2.
This distance also determines the probability that the system flips to the alternative state.
A more resilient ecosystem is less likely to receive a catastrophic regime shift.
- resilience "insures" the ecosystem against functional failure
- resilience "insures" users of the system against welfare loss
However, even it can be interpred as an insurance, this doesn't fully capture its total economical value, since it doesn't represent that:
- higher resilience will raise expected income
- resilience raises/lowers the perceived riskiness of income
In general, according to Walker and Salt (2012), a resilient world values:
- diversity: multiple species, livelihoods, institutions, and strategies make a system less fragile.
- ecological variability: systems should be able to absorb shocks such as droughts, floods, or price swings without breaking.
- modularity: if parts of the system are partially separated, local failures are less likely to spread everywhere.
- slow variables and thresholds: policy should monitor the long-run drivers that change slowly but can push the system past a tipping point.
- tight feedbacks: problems should be detected quickly, so the response comes before damage compounds.
- social capital: trust, cooperation, and shared norms help people coordinate under stress.
- innovation: resilience depends on the ability to adapt and reorganize when conditions change.
- overlap with governance: institutions should match the scale of the ecological system they manage.
- ecosystem services: healthy ecosystems provide the background services that support human well-being and adaptation.
14. Measuring Sustainable Development
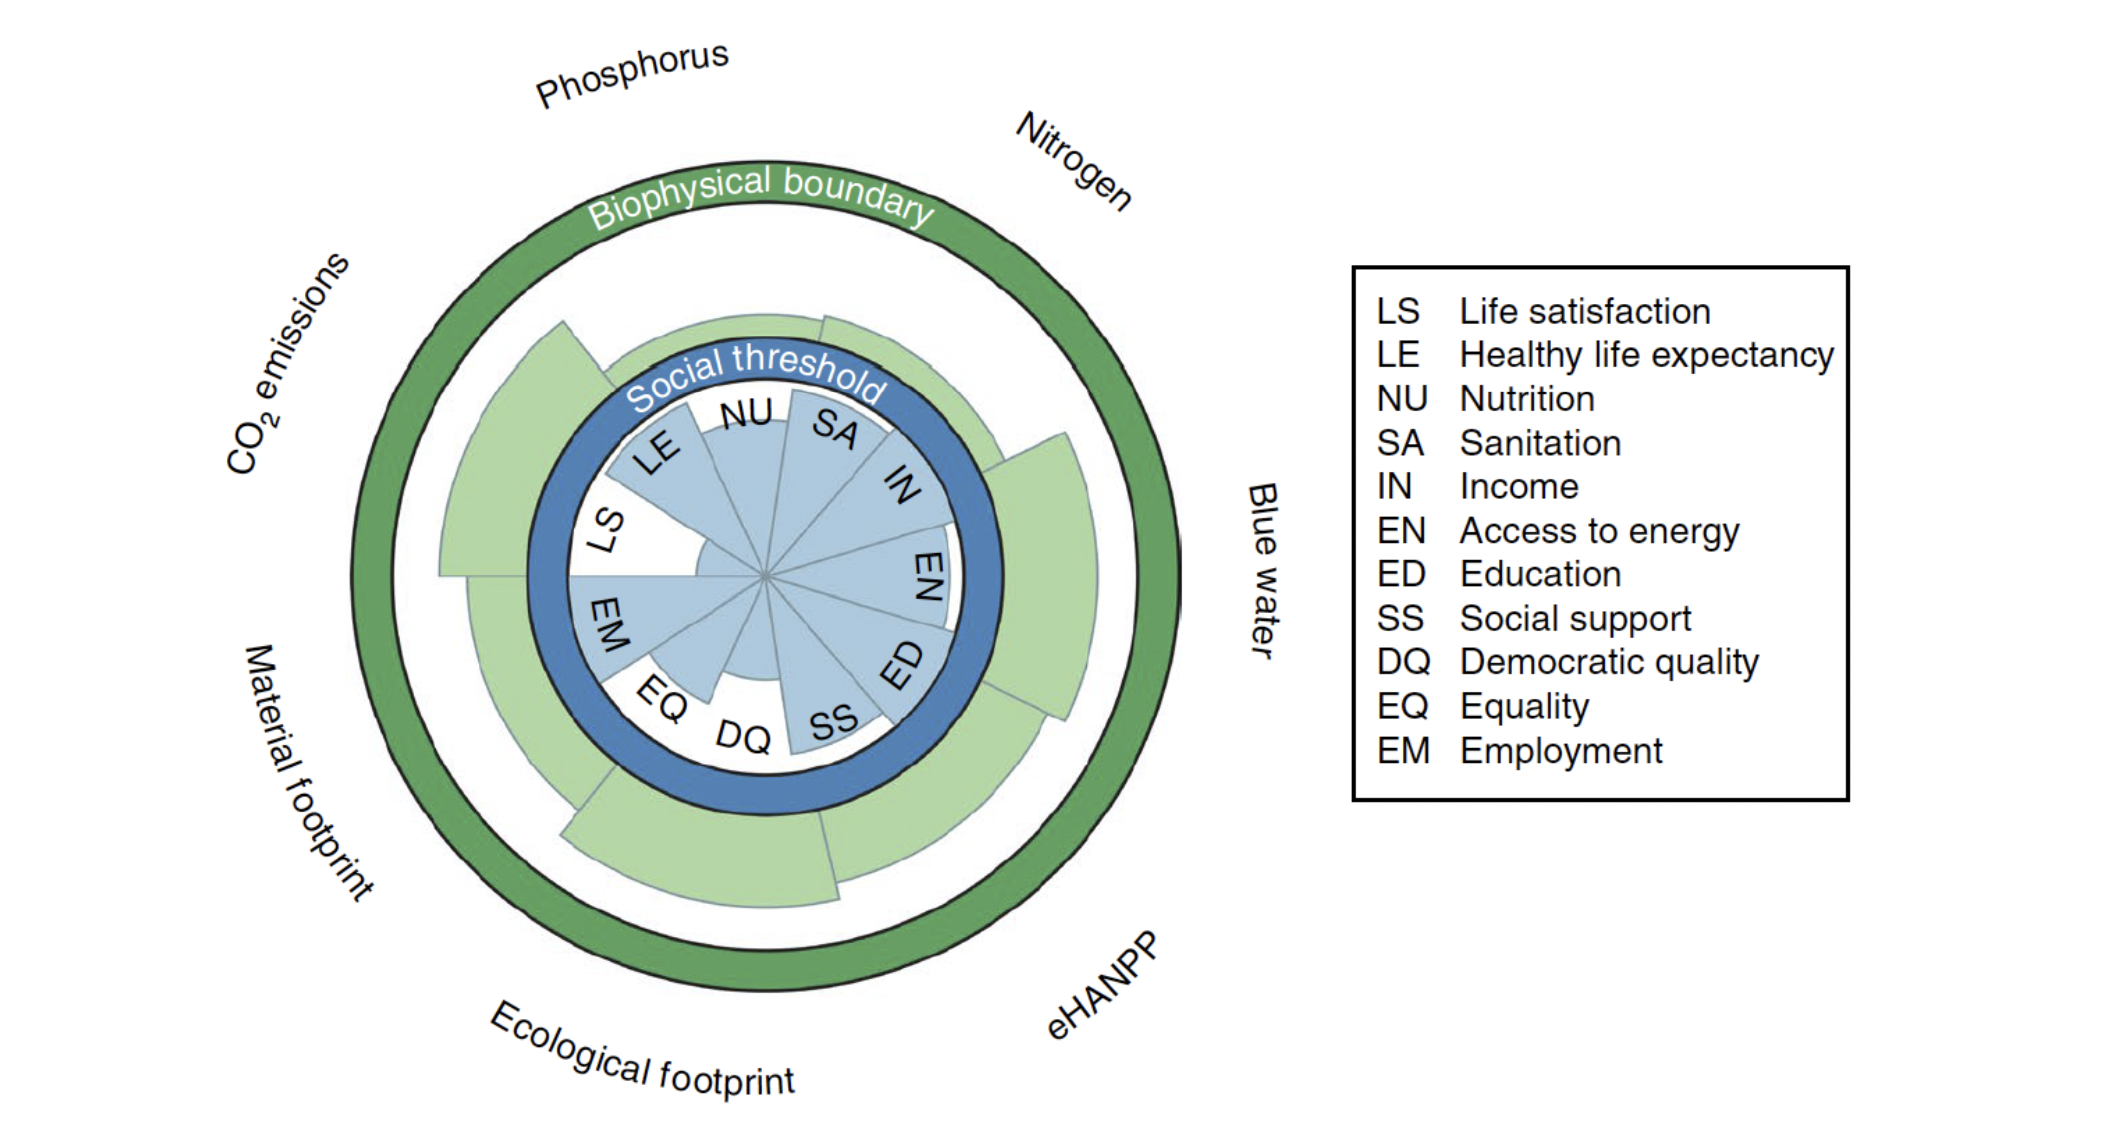
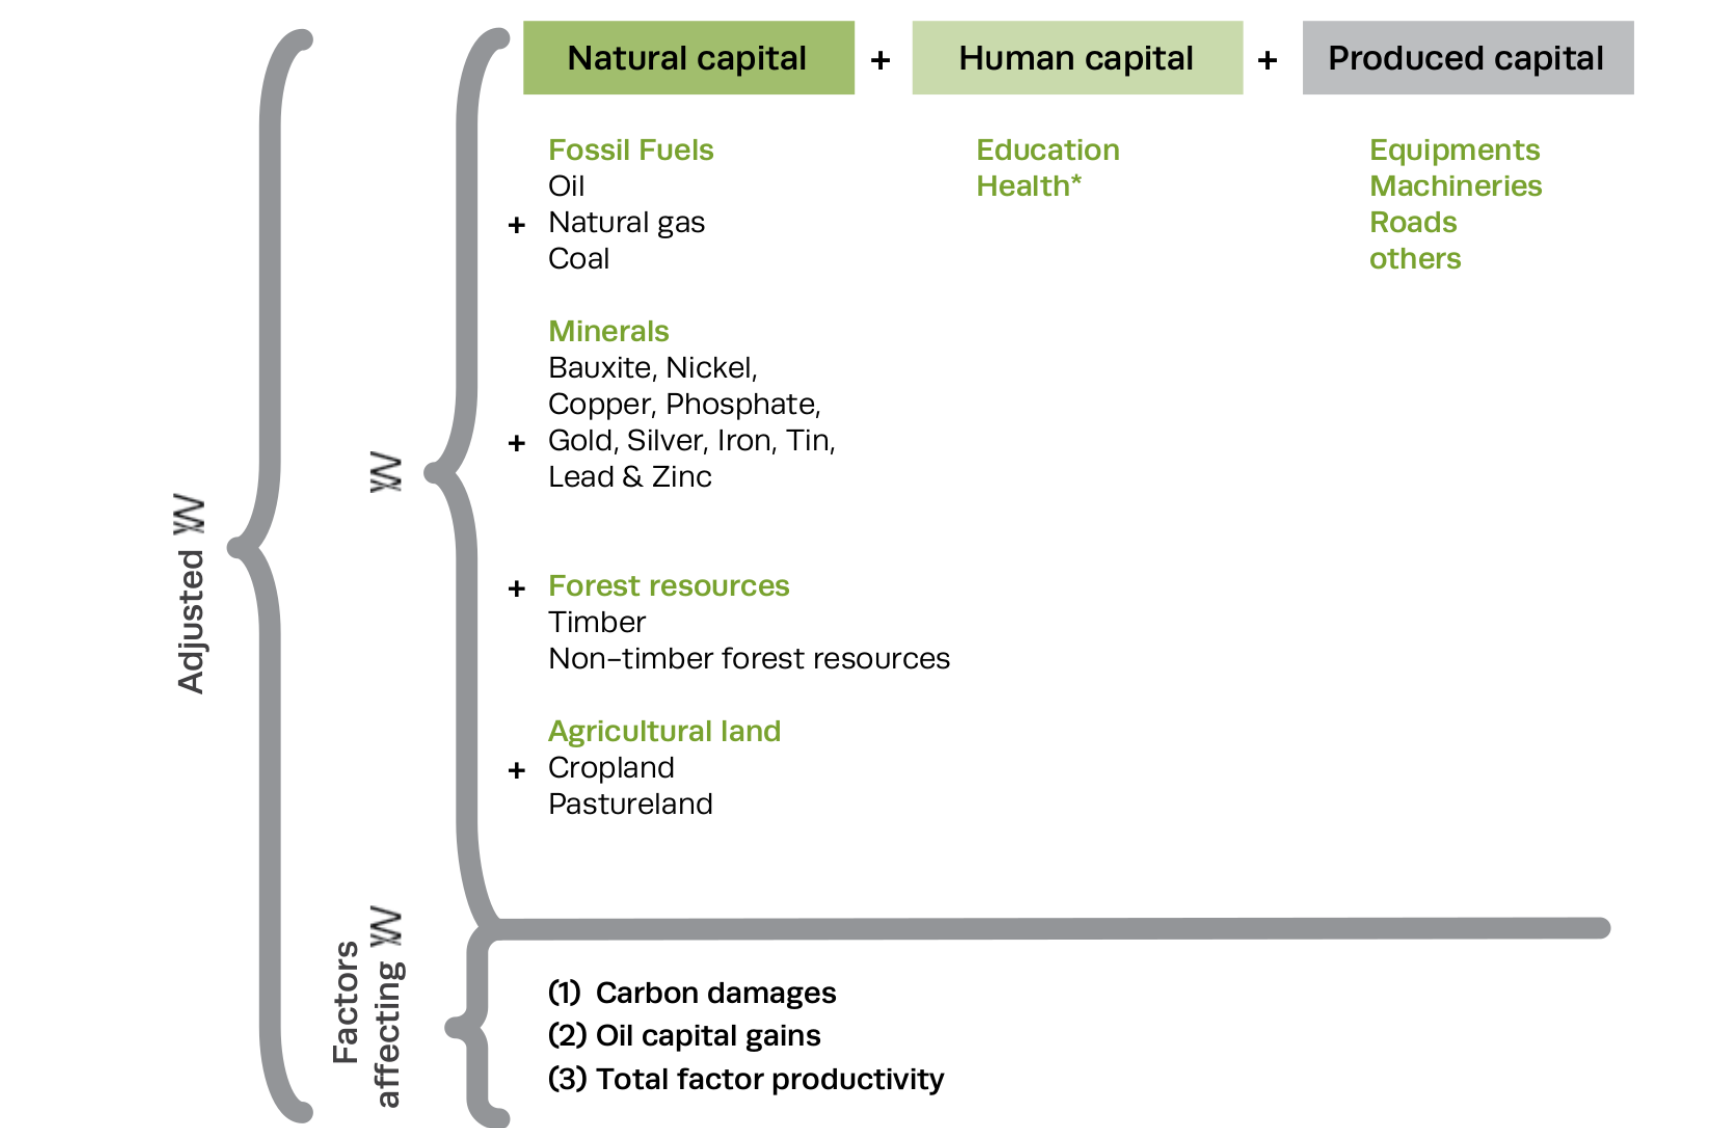
Money-metric wealth measuresTo assess where we are making progress towards sustainable development, we look at comprehensive wealth, given by the sum of all capital stocks valued at "shadow prices" that represent their contribution to current and future well-being.
We then distinguish two different paradigms:
- weak sustainability: all forms of capital are substitutes; it allows for the depletion of natural resources so long as such depletion is offset by an increase in other forms of capital
- strong sustainability: all forms of capital must be maintained intact independent of one another. Different forms of capital are mainly complementary.
Are we consuming too much?
We consider the discounted present value of the utility stream problem as:
and we consider the change of intertemporal social welfare as:
Whether society is on a sustainable path depends particularly on the change of the resource base:
where is the change of stock and the shadow price.
Arrow et al. in 2004 concluded that:
- the consumption's share of output is likely to be higher than what is prescribed by the present value criterion we are consuming too much!
- several nations fail to meet the sustainability criterion their investment in human and physical capital is not sufficient to offset the depletion of natural capital.
Under some assumptions, we can consider inclusive wealth as a measure of sustainability by setting:
- value of investment in human-made capital value of extraction from natural resources
- using shadow prices to value natural and human capital
However, the requirement to value investment at shadow prices introduces uncertainty since a shadow price is forward-looking and determined by current capital stocks and exogenous factors.
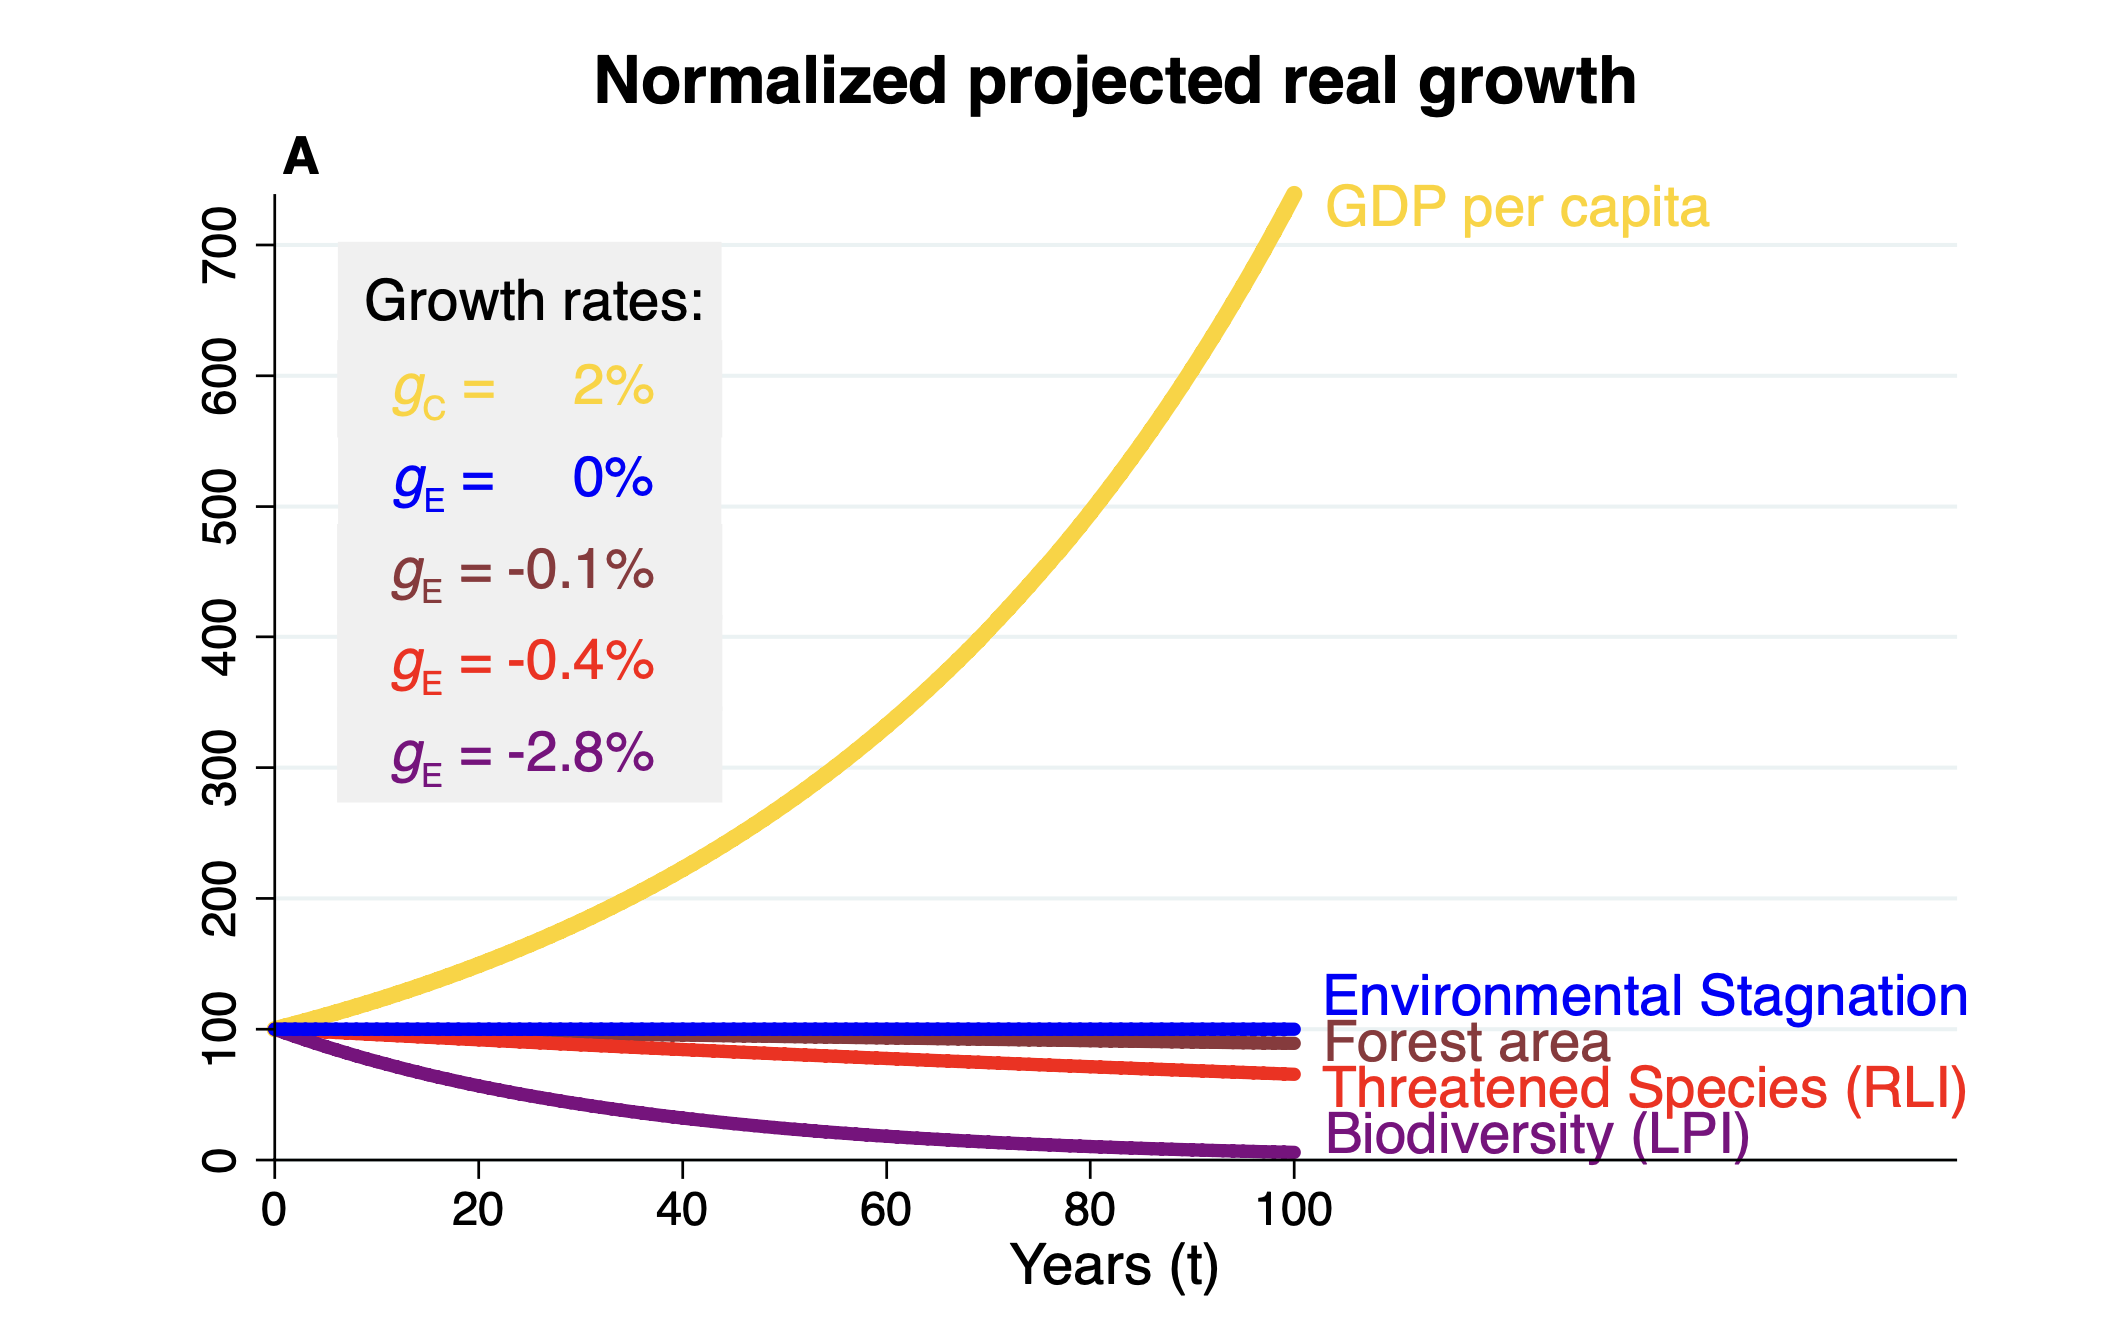
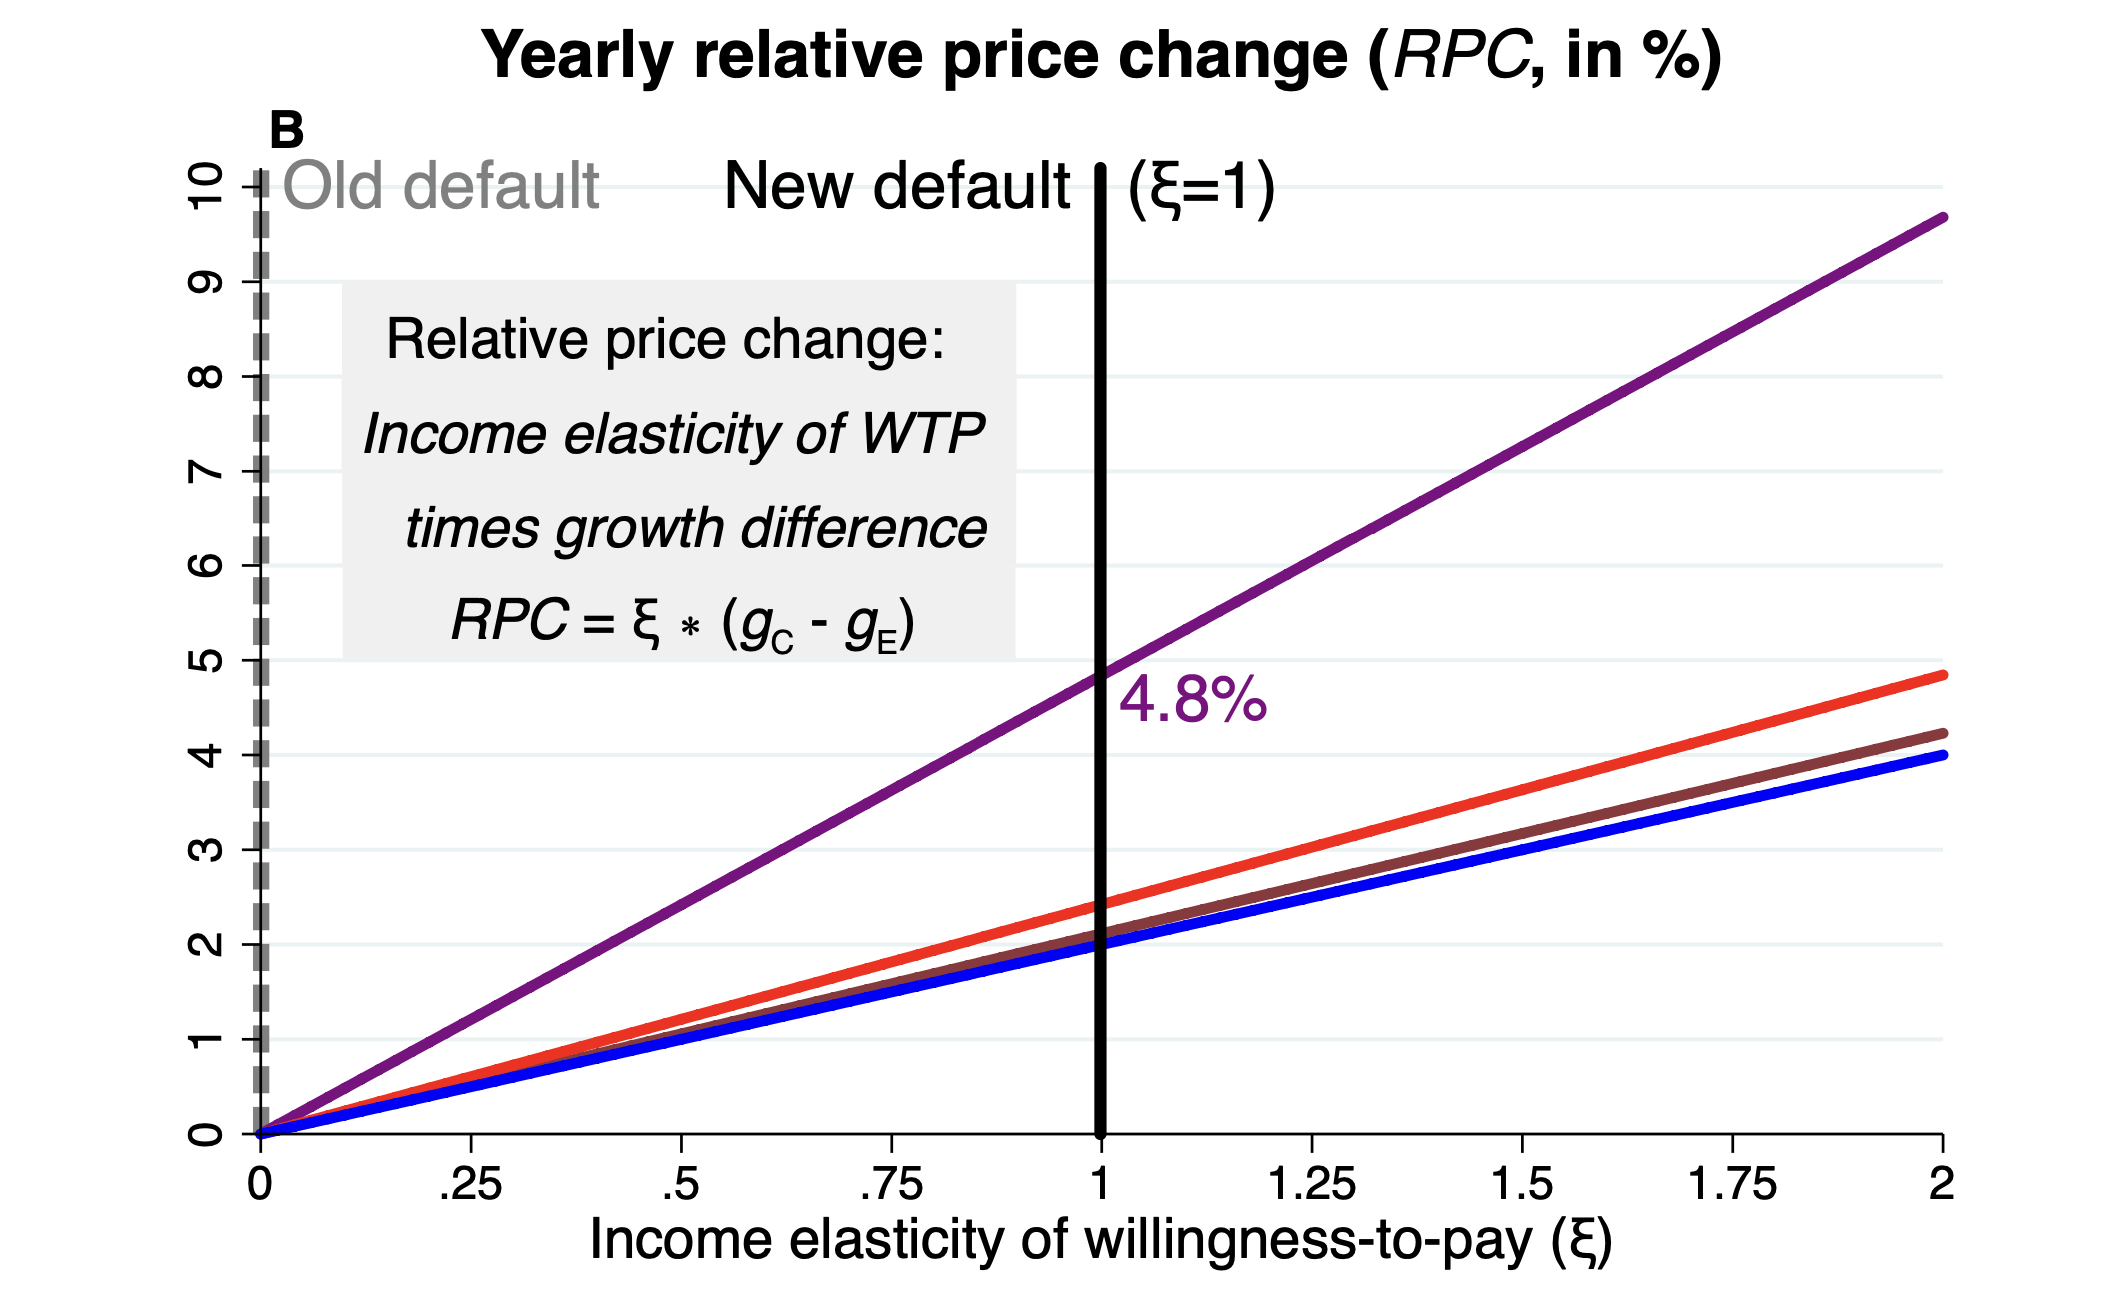
To account for changing public natural capital values (and then changing willingness-to-pay for environmental services) we can define a simple annual relative price change (RPC):
- is the elasticity of substitution (which can be tied to the income-elasticity of willingness-to-pay)
- is the growth rate of human-made capital/consumption
- is the growth rate of the environmental good.
Intuition: if consumption grows faster than the environment () and goods are substitutable (), the relative price (or shadow price) of environmental services tends to rise over time and RPC will be positive.
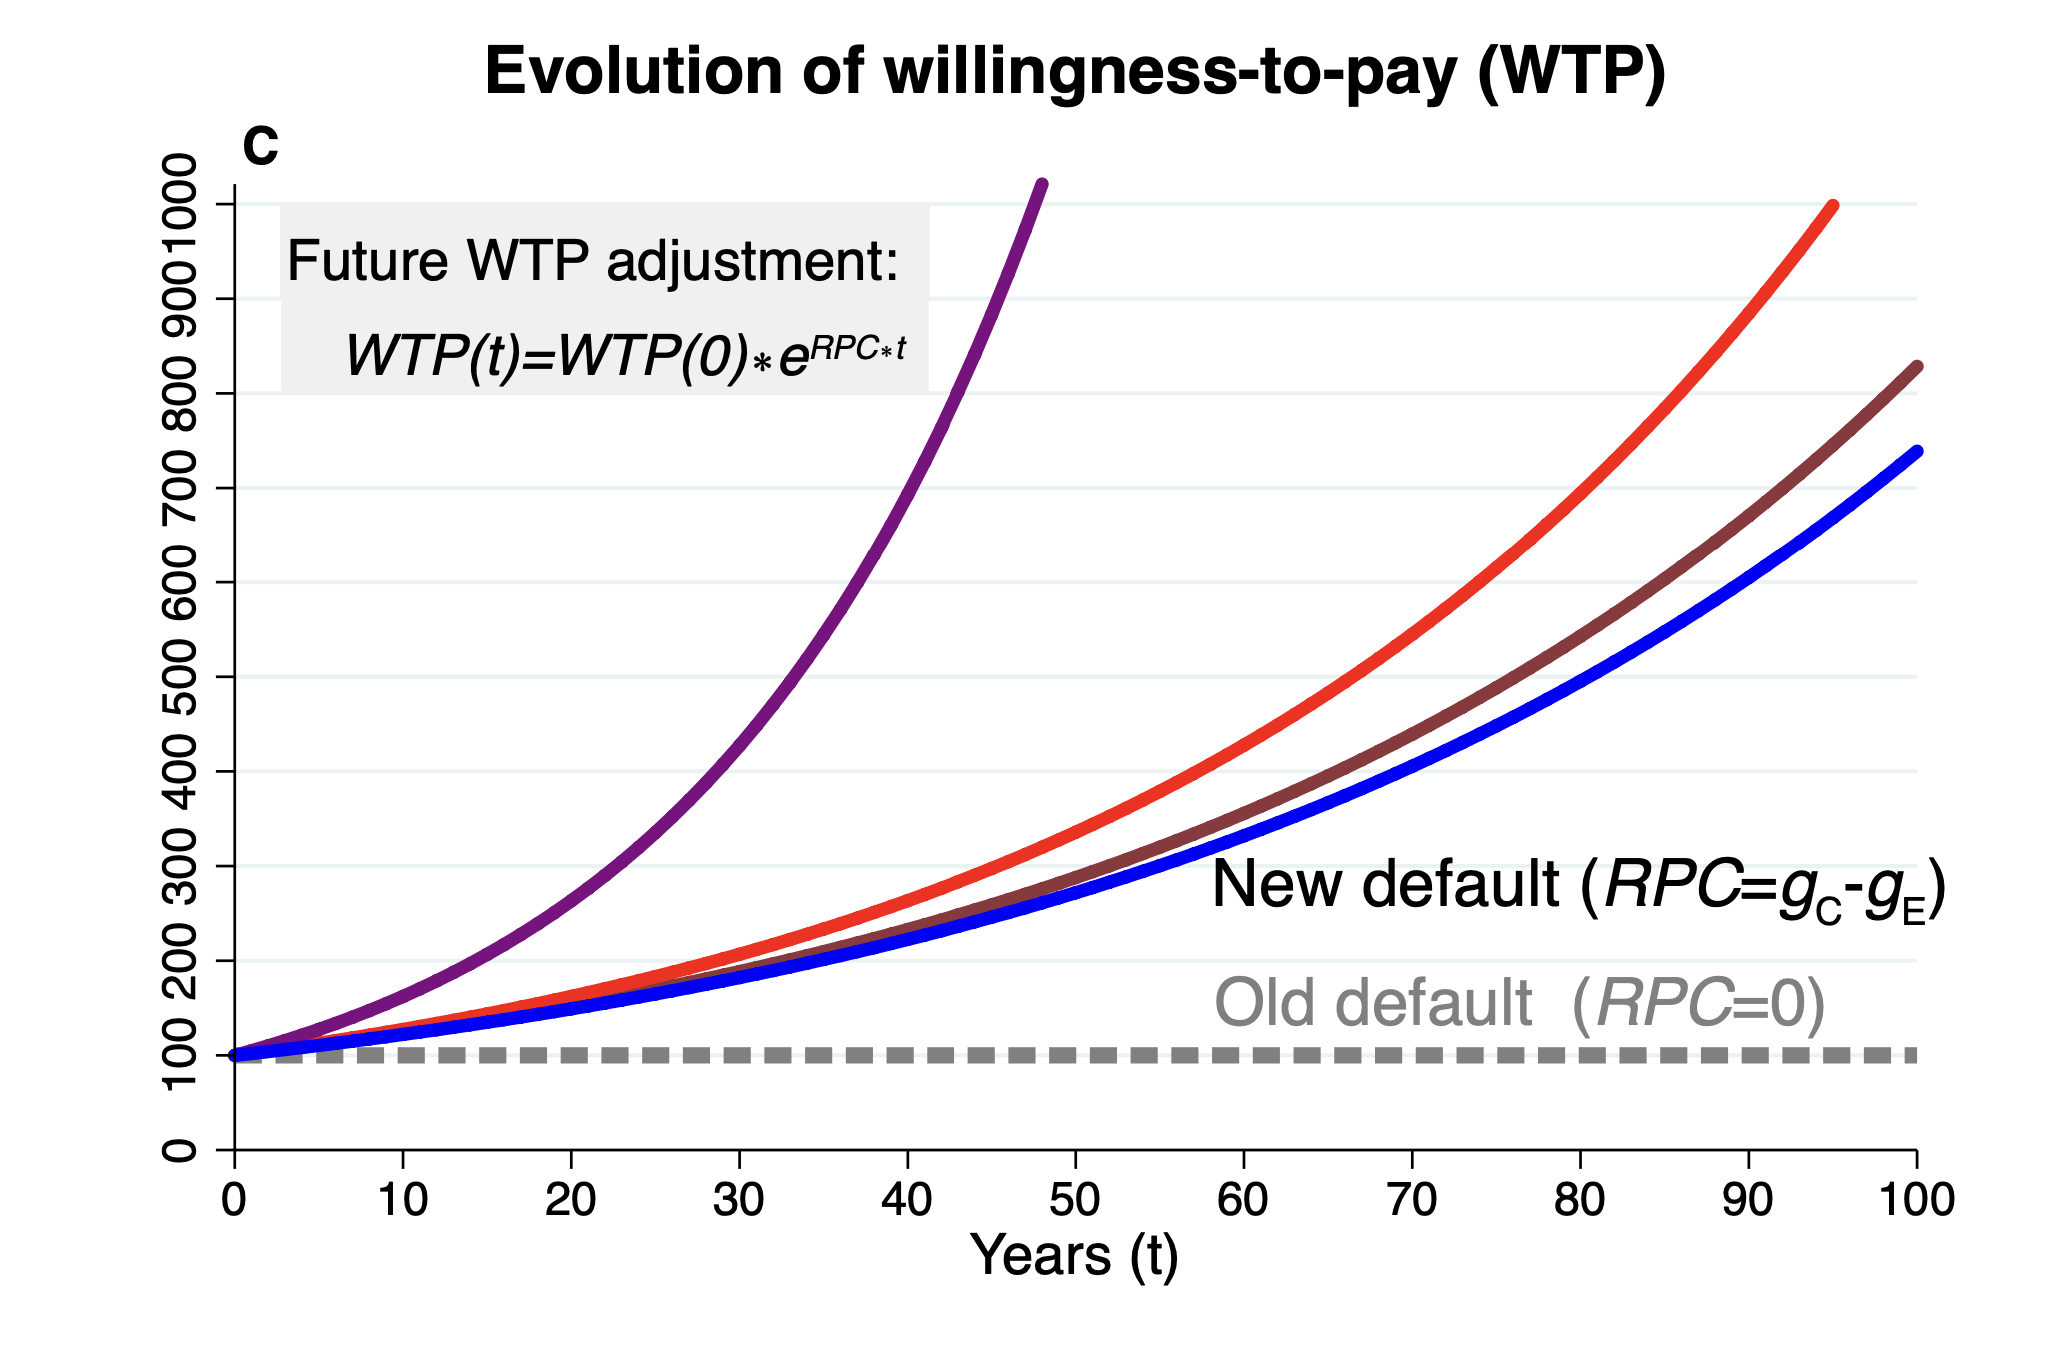
If the time-0 willingness-to-pay for the environmental service is and it evolves proportionally with RPC, we can write
The present value over a horizon using a discount rate is then
provided . The expression is simply the integral of an exponential growth/decay factor; when the numerator decays more slowly, raising the present value compared to the case .
If the integral simplifies to
which is the limiting case where growth of willingness-to-pay exactly offsets discounting.
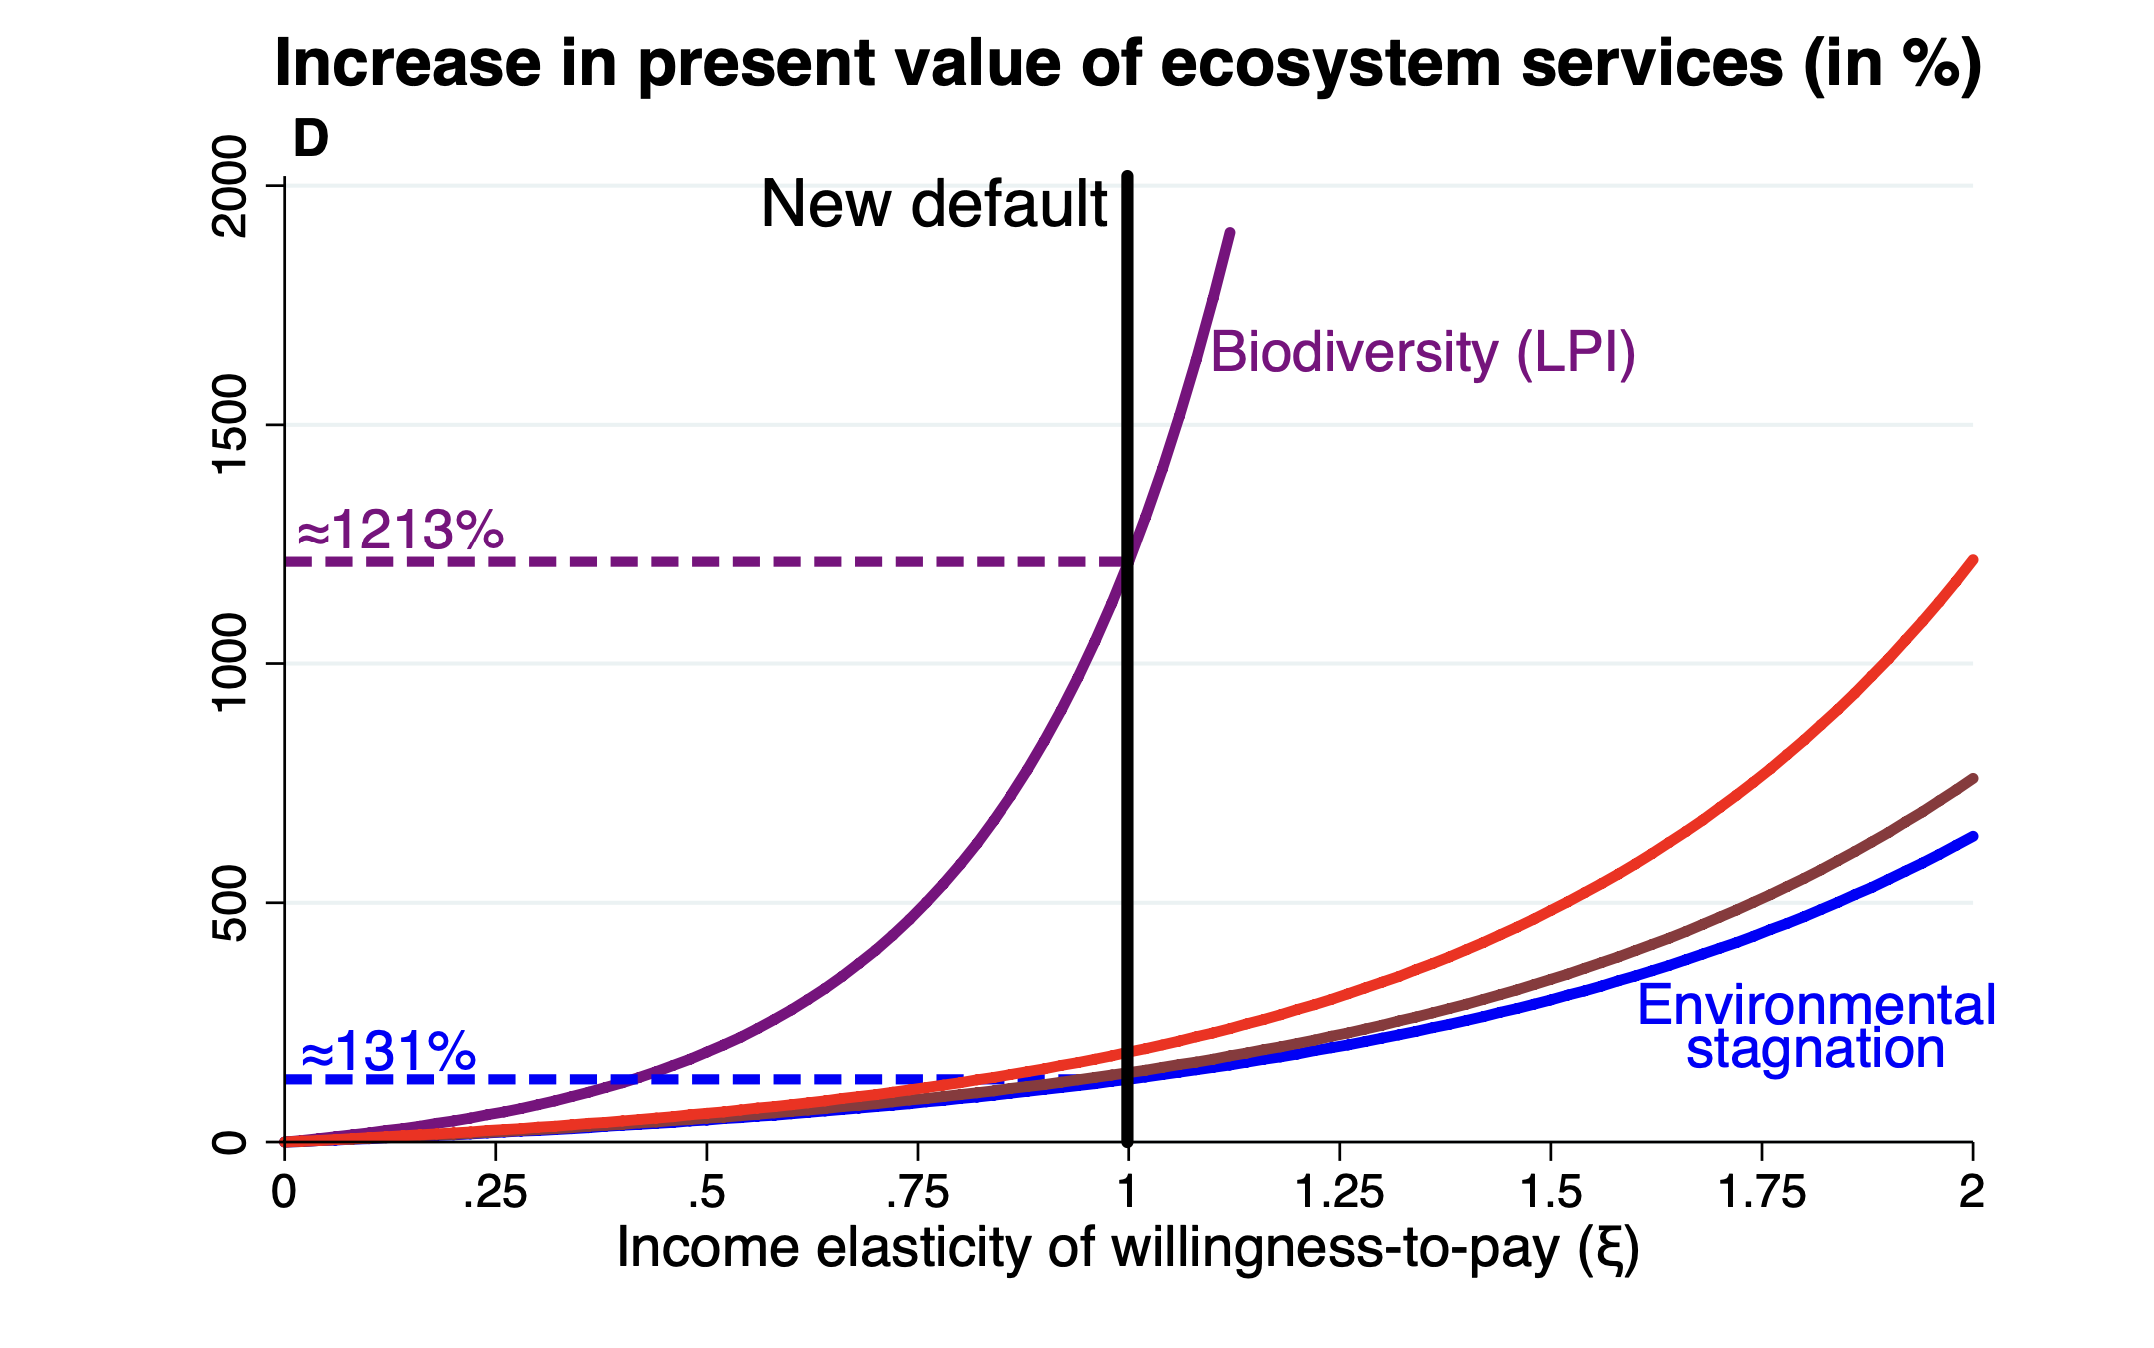
We can compare this to the baseline case with no RPC (i.e. ). The baseline present value is
Define the relative change in present value as
This ratio isolates how much larger (or smaller) the present value becomes when we account for changing relative prices of environmental goods.
Numerical example
Consider , ,
So we have 1.5%/yr. With a discount rate and horizon years,
so
giving
_Intuition: considering a rising shadow price of environmental services (positive RPC) can increase the estimated present value of ecosystem benefits.
Dashboard approaches
The most famous dashboard indicator is the UN Sustainable Development 17 Goals (SDG) framework, containing 231 indicator, also known as the "world'd most important to-do list".
The 17 Goals - United Nations WebsiteA similar framework is the MONET 30 indicator system, used in Switzerland to provide a picture about sustainability in the country through more tham 100 indicators.
The MONET 30 system - Website .
Composite Index
Key problems for building a composite index include:
- the choice of appropriate indicators and their measurement
- normalization and data trasformation
- weighting and aggregation
Human Development Index (HDI)
The index is simply the arirthmetic mean of:
- the life epxectancy index (LEI): life expectancy at birth
- education index (EI): mean and expected years of schooling
- Indome index (II): the logarithm of GNI per capita
Note that this index allows to easily compensate poor performance in one area with anoter.
To address this criticism, the HDI is computed, since 2001, using the geometric mean as:
Do you wanto to track your country's performance? Just use the tool!In general, if we want to measure strong/weak sustainability and we have to combine different inicators, we have multiple approach to determine and combine these three index (also depending on how much we want the substitution/compensation to be strong)
- Strong compensation: arithmetic mean ()
- Imperfect compensation: geometric mean ()
- Imperfect/minimum compensation: harmonic mean ()
- Minimum compensation: min ()
The generalized mean can then be defines as:
Sachs et al. (2022) computed SDG indices for the UN sustainable goals based on this method using the aritmetic mean, so the SDG index can be considered an assessment of SDG performance allowing for substitutability.
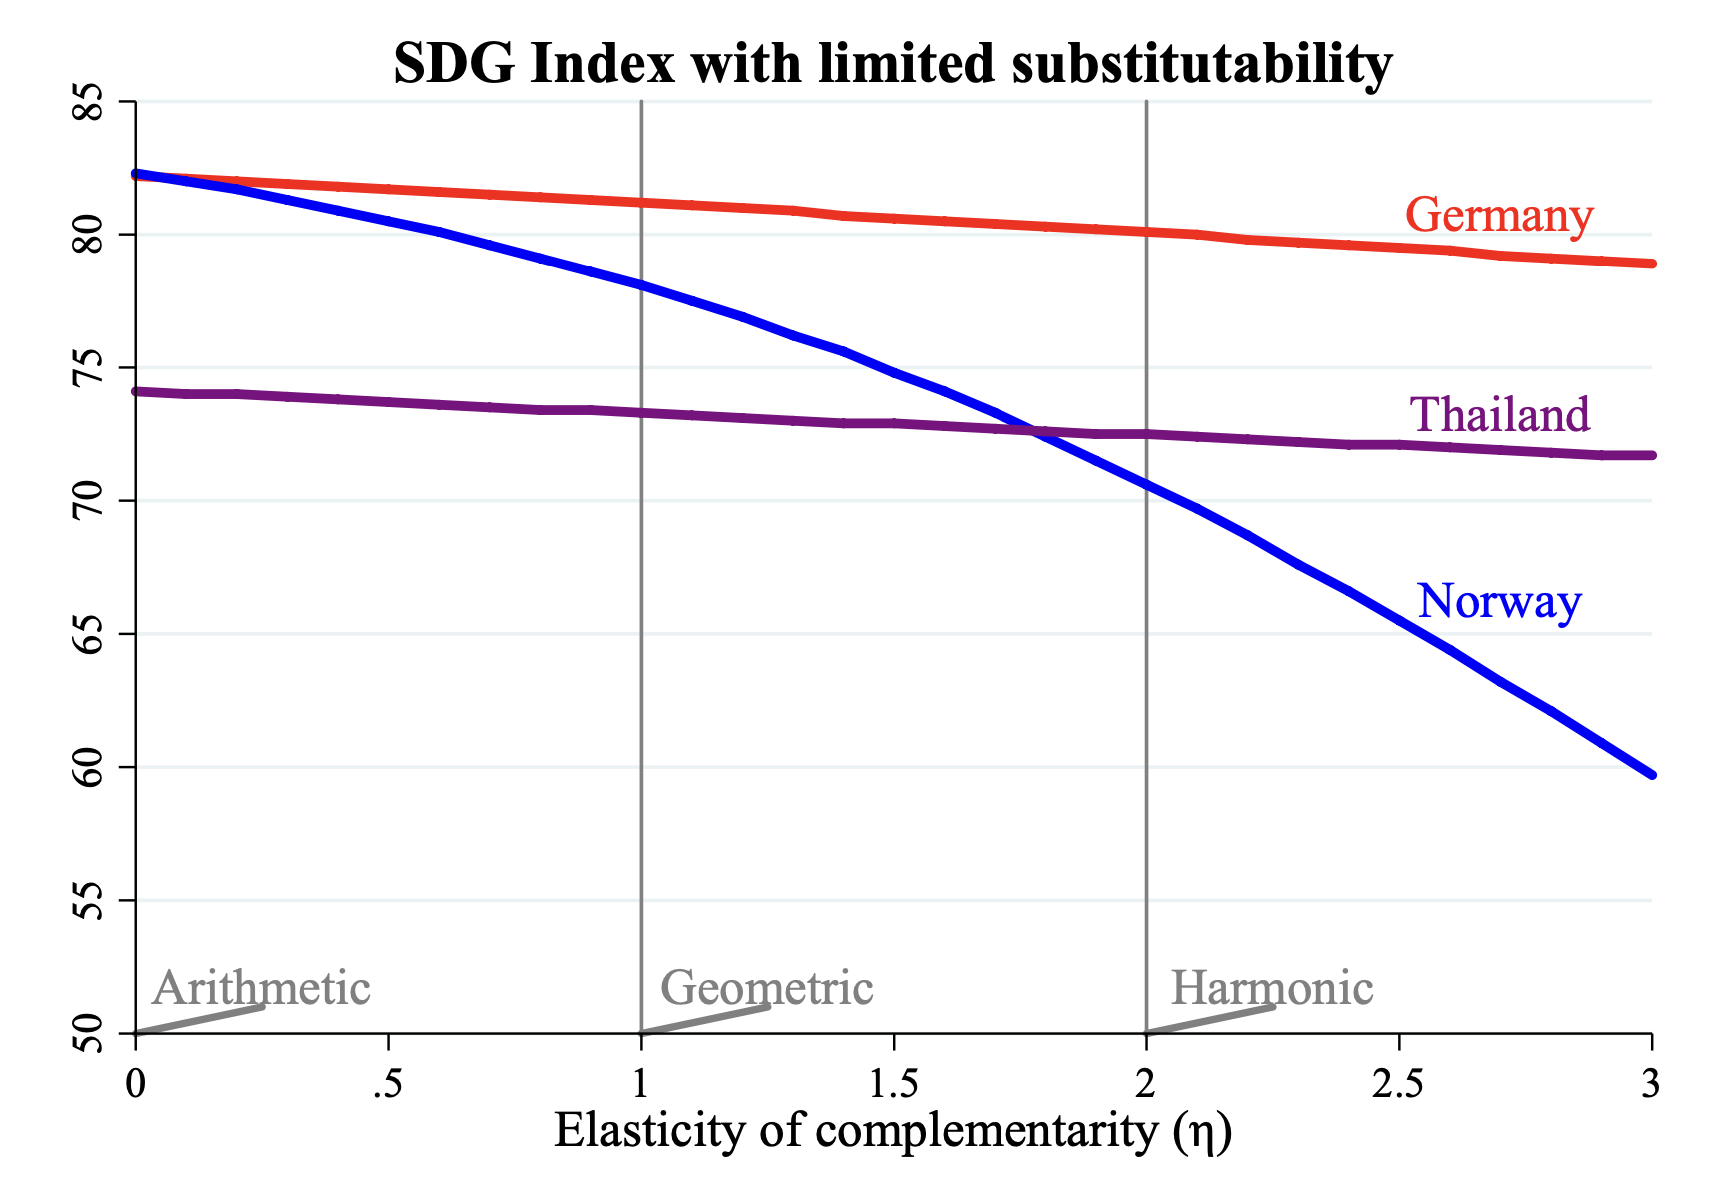
Recall that the generalized mean is
with any value of larger than zero indicates higher completarity/less substitutability, with indicase perfect substitutes.
This has the same functional form of the standard Constant Elasticity of Substitution (CES) utility function, that, for two goods, is defined as:
So, if we can estimate the preference parameter of this utility function for individuals, we can also understand their preference regarding the index aggregation of the OHI.
Disque et al. (2025) ran a large choice experiment (>6,000 respondents across 12 coastal countries). Participants repeatedly allocated scores between randomly drawn goal pairs under varying budget lines (exogenous changes in relative prices), which identifies the preference weight and the substitution parameter .
More about the research project can be found here..
From the scores, an estimation of the corresponding CES demand function can be done with:
where are generated using a non-linear maximum likelihood model.
Does it still make sense?
Sustainability has multiple dimensions. Just for the SDGg, we have more tham 300 indicators. Does it make sense to compress both into one metric?
The Stiglitz-Sen-Fitoussi commission provides the following answer:
“When driving a car, a meter that added up in one single number the current speed of the vehicle and the remaining level of gasoline would not be of any help to the driver. Both pieces of information are critical and need to be displayed in distinct, clearly visible areas of the dashboard.