The following notes come from the course Principle of Microeconomics, held by Massimo Filippini at ETH Zurich.
Warning: up to , the following page is 100% content-wise AI-free, so excuse me for human mistakes & typos. Enjoy!
Index:
- Introduction to Economics
- Supply and Demand
- Elasticity & Theory of Consumer Demand
- The Cost of Production
- Theory of Cost, Consumer & Producer Surplus
- Market Failures & Behavioral Anomalies
- Consumer, Producer Surplus & Welfare Analysis
- Public Sector & the Tax System
- Firms in Competitive Markets
- Monopoly
- Monopolistic Competition
- Oligopoly
- International Trade
- Exercises
1. Introduction to Economics
Economics is the study of how societies use scarse resources to produce and consume goods and services.
Each society's objective is to maximise the the well-being of current and future generations, while facing the following basic economics problems:
- Which goods to produce and in what quantities?
- How to produce the goods, which resources and what kind of technology should be used?
- For whom are the produced goods?
- How to produe and consume goods in a sustainable way?
Basic Principles of Economics (Neoclassical Theory)
- People face trade-offs: making decisions requires trading off one goal, with all his benefits and disadvantages, against another.
- Opportunity Cost: decisions require comparing costs and benefits or alternatives: the opportunity cost of an item is what you give up to obtain that item.
- Rational People think at the Margin: marginal changes are small, incremental adjustments to an existing plan: the economical corresponding concept of derivative. People make decisions by comparing costs and benefits at the margin.
In comparison to neoclassical microeconomics, behavioral economics considers psychological aspects to better explain people's behavior in the markets, often assuming that humans are not always rational and don't always maximise their self-interest.
How people interact?
If people/countries/firms own different resources or good and have different desires, they trade with the goal of increasing the general well-being. An econmics system in which resources are traded and allocated throught the decisions of different agents is called market economy.
Adam Smith demostrated that in a market economy characterized by competitive markets, trade between agents leads to the maximization of the well being. This concept is widely famous as the "invisible hand".Understanding the Invisible Hand in Economics: Key Insights [INVESTOPEDIA].
In a market economy, or more generally, in every society, agents make decisions about both the usage of:
- Inputs (Resources) : everything that the agent uses in the production process.
- Outputs (Goods): everything that results from the production process.
The Production Possibilities Frontier (PPF) shows all the possible combinations of ouput given the available resources.
In a two goods economy, it represents all the possible pairs that can be produced or, in other words, the amount of you have to sacrifie to obtain a certain amount of .
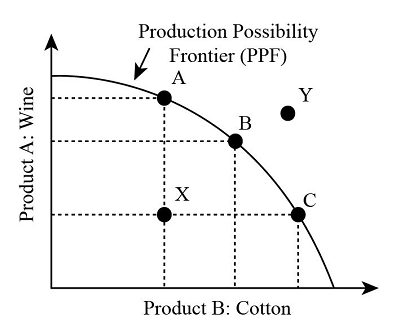
Shift of the PPF to the top-right represent a sustainable growth.
Production Possibility Frontier (PPF): Purpose and Use in Economics [INVESTOPEDIA].2. Supply and Demand
Supply and demand are the forces that make the market economies work, by determining the quantity produced and price at whith it is sold.
Quantity demanded is the amount of a good that the agents are willing to nuy at a given price.
- The demand curve is the relationship between the quantity demanded and the price of a good. In formulas:
- The market demand is the sum of all individuals demands for a good.
Movements in the price of a good can lead to:
- The Income Effect: if the incomes remain costant, then a fall in the price means that customer can afford and will buy more.
- The Substitution Effect: if the price falls, customers will to substitute more expensive goods with the "falling one".
Therefore, we can define relations between demanded goods:
- Substitutes: two goods for which the increase in the price of one leads to an increase in the demand of the other (example: CocaCola and Pepsi).
- Complements: two goods for which the increase in the price of one leads to a decrease in the demand of the other (example: petrol and cars).
Quantity supplied is the amount of a good that sellers are willing and able to sell.
- The Law of Supply states that the quantity supplied rises when the price of the good rises, in other words: is an increasing function.
The Equilibrium Price is the price at which .
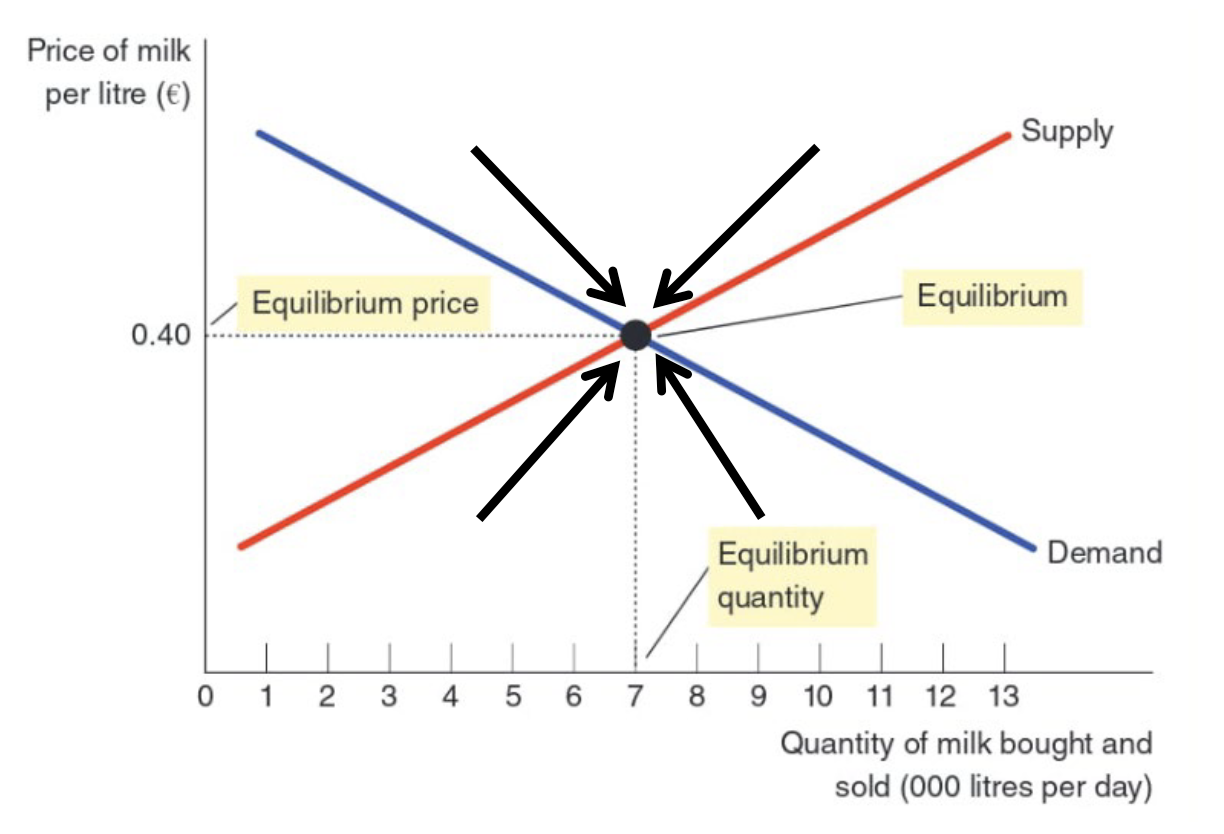
- Market prices act as signals about how scarse resources are.
- Prices provide information to both producers and buyers:
- A high price tells that a product is demanded, a low price that the good is oveproduced.
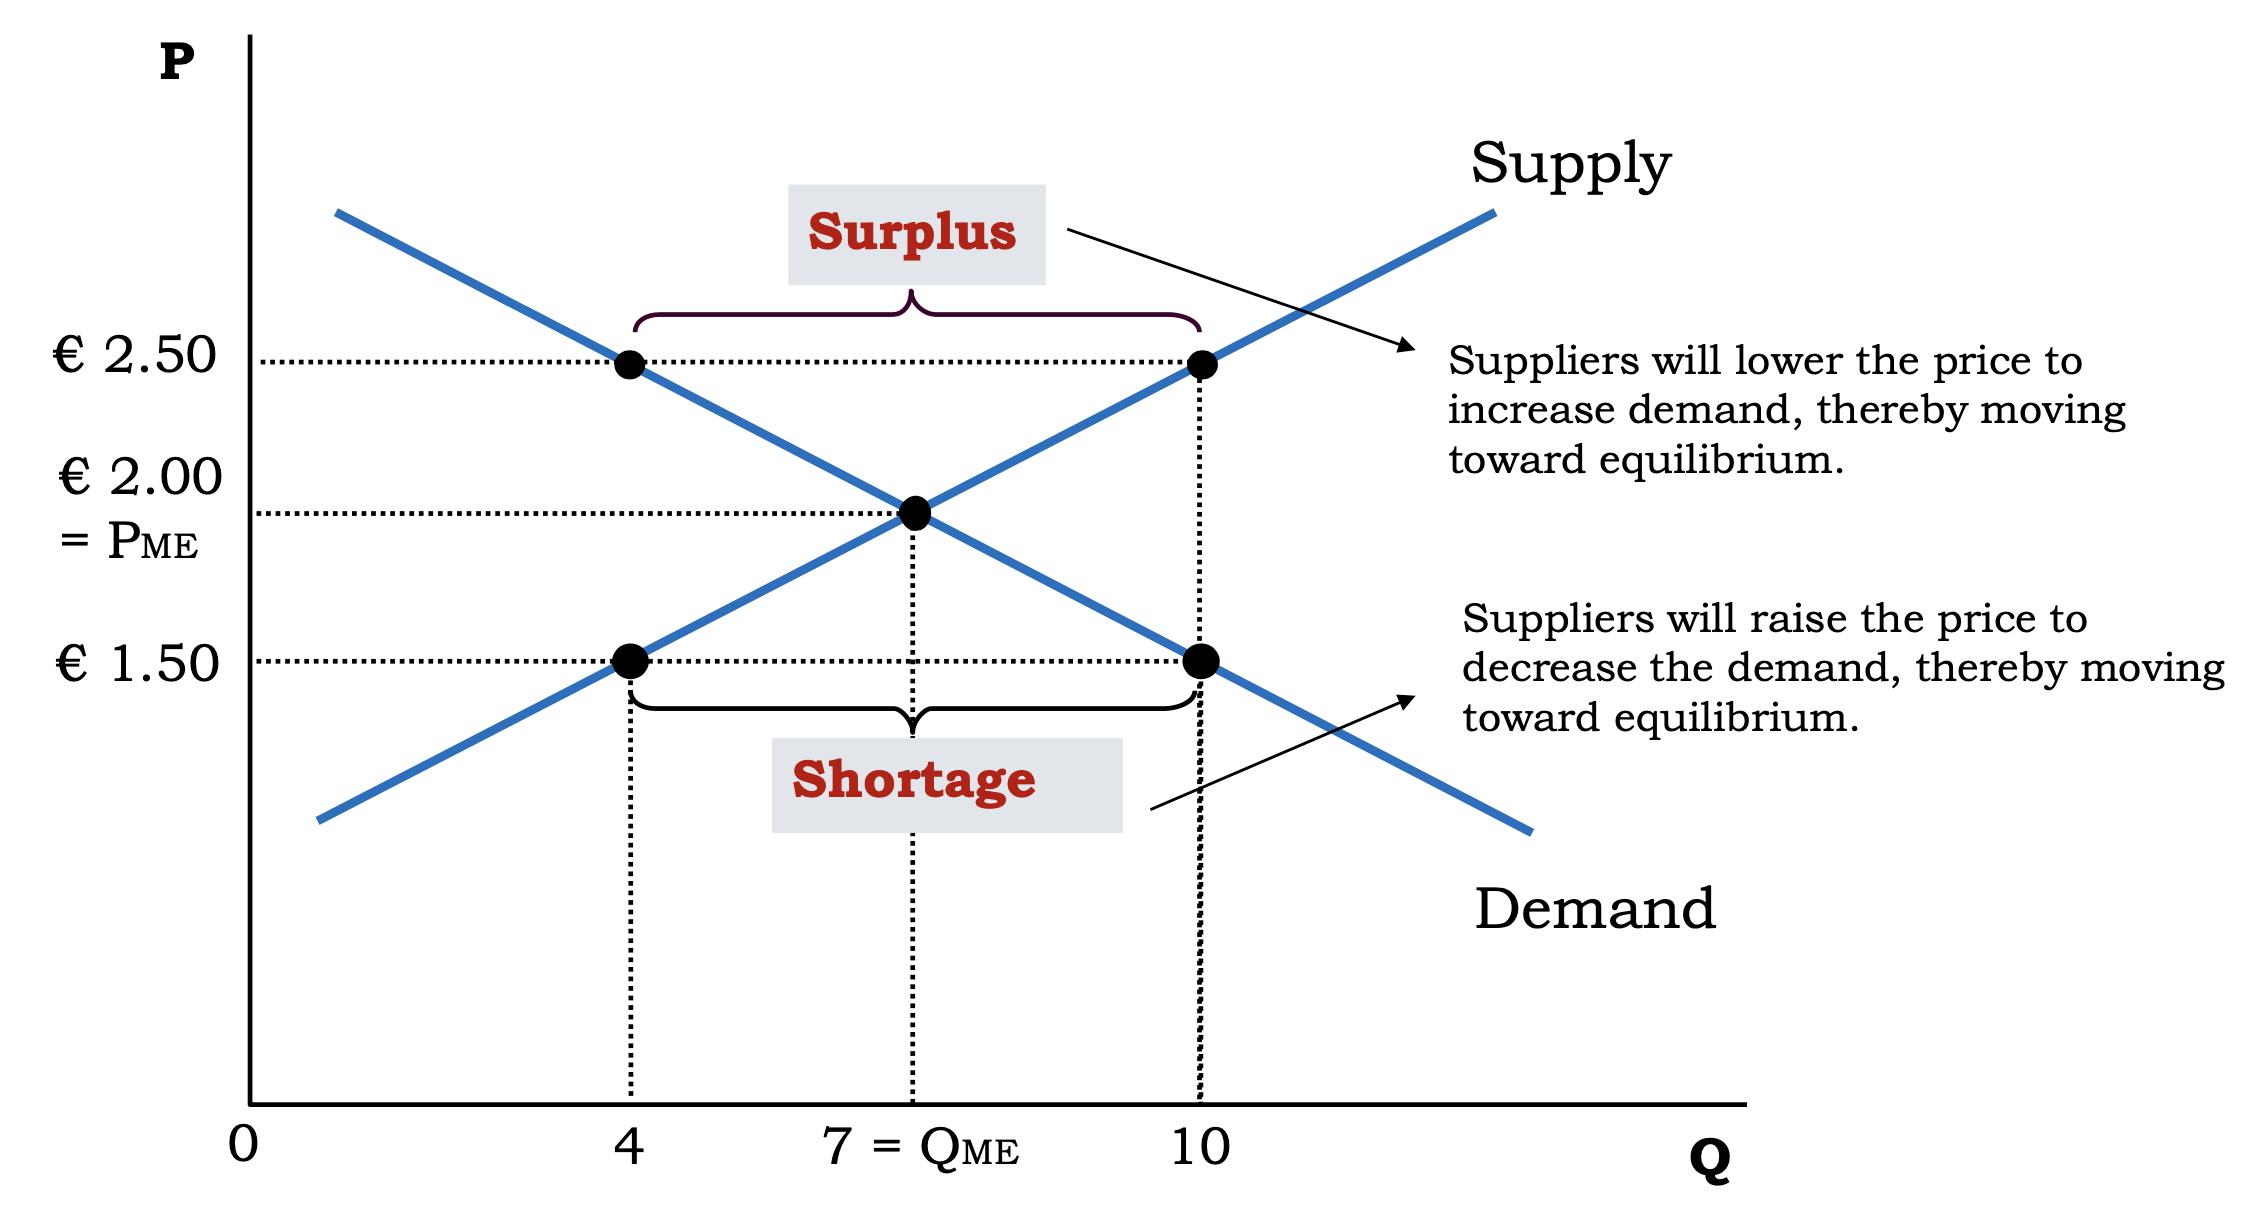
Controls on Prices
Controls on prices are often put when policymakers believe the market price is unfair. They can result in:
- Price ceiling: legal maximum
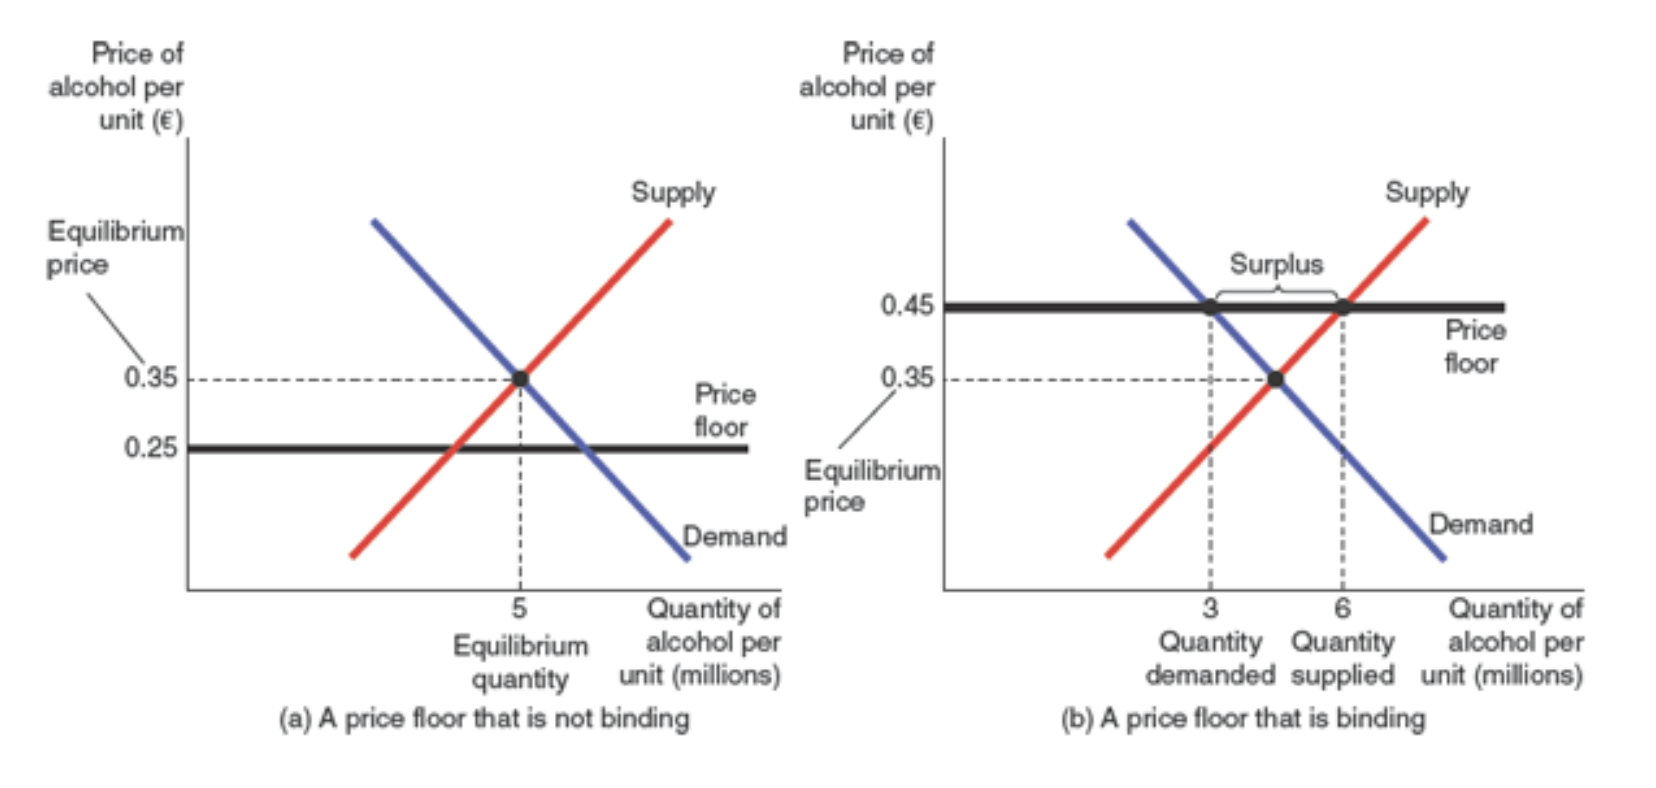
- Price floor: legal minimum
When a policymaker puts a price floor , the equilibrium is given by:
If , we say that thet control is not binding (left), otherwise it is binding (right).
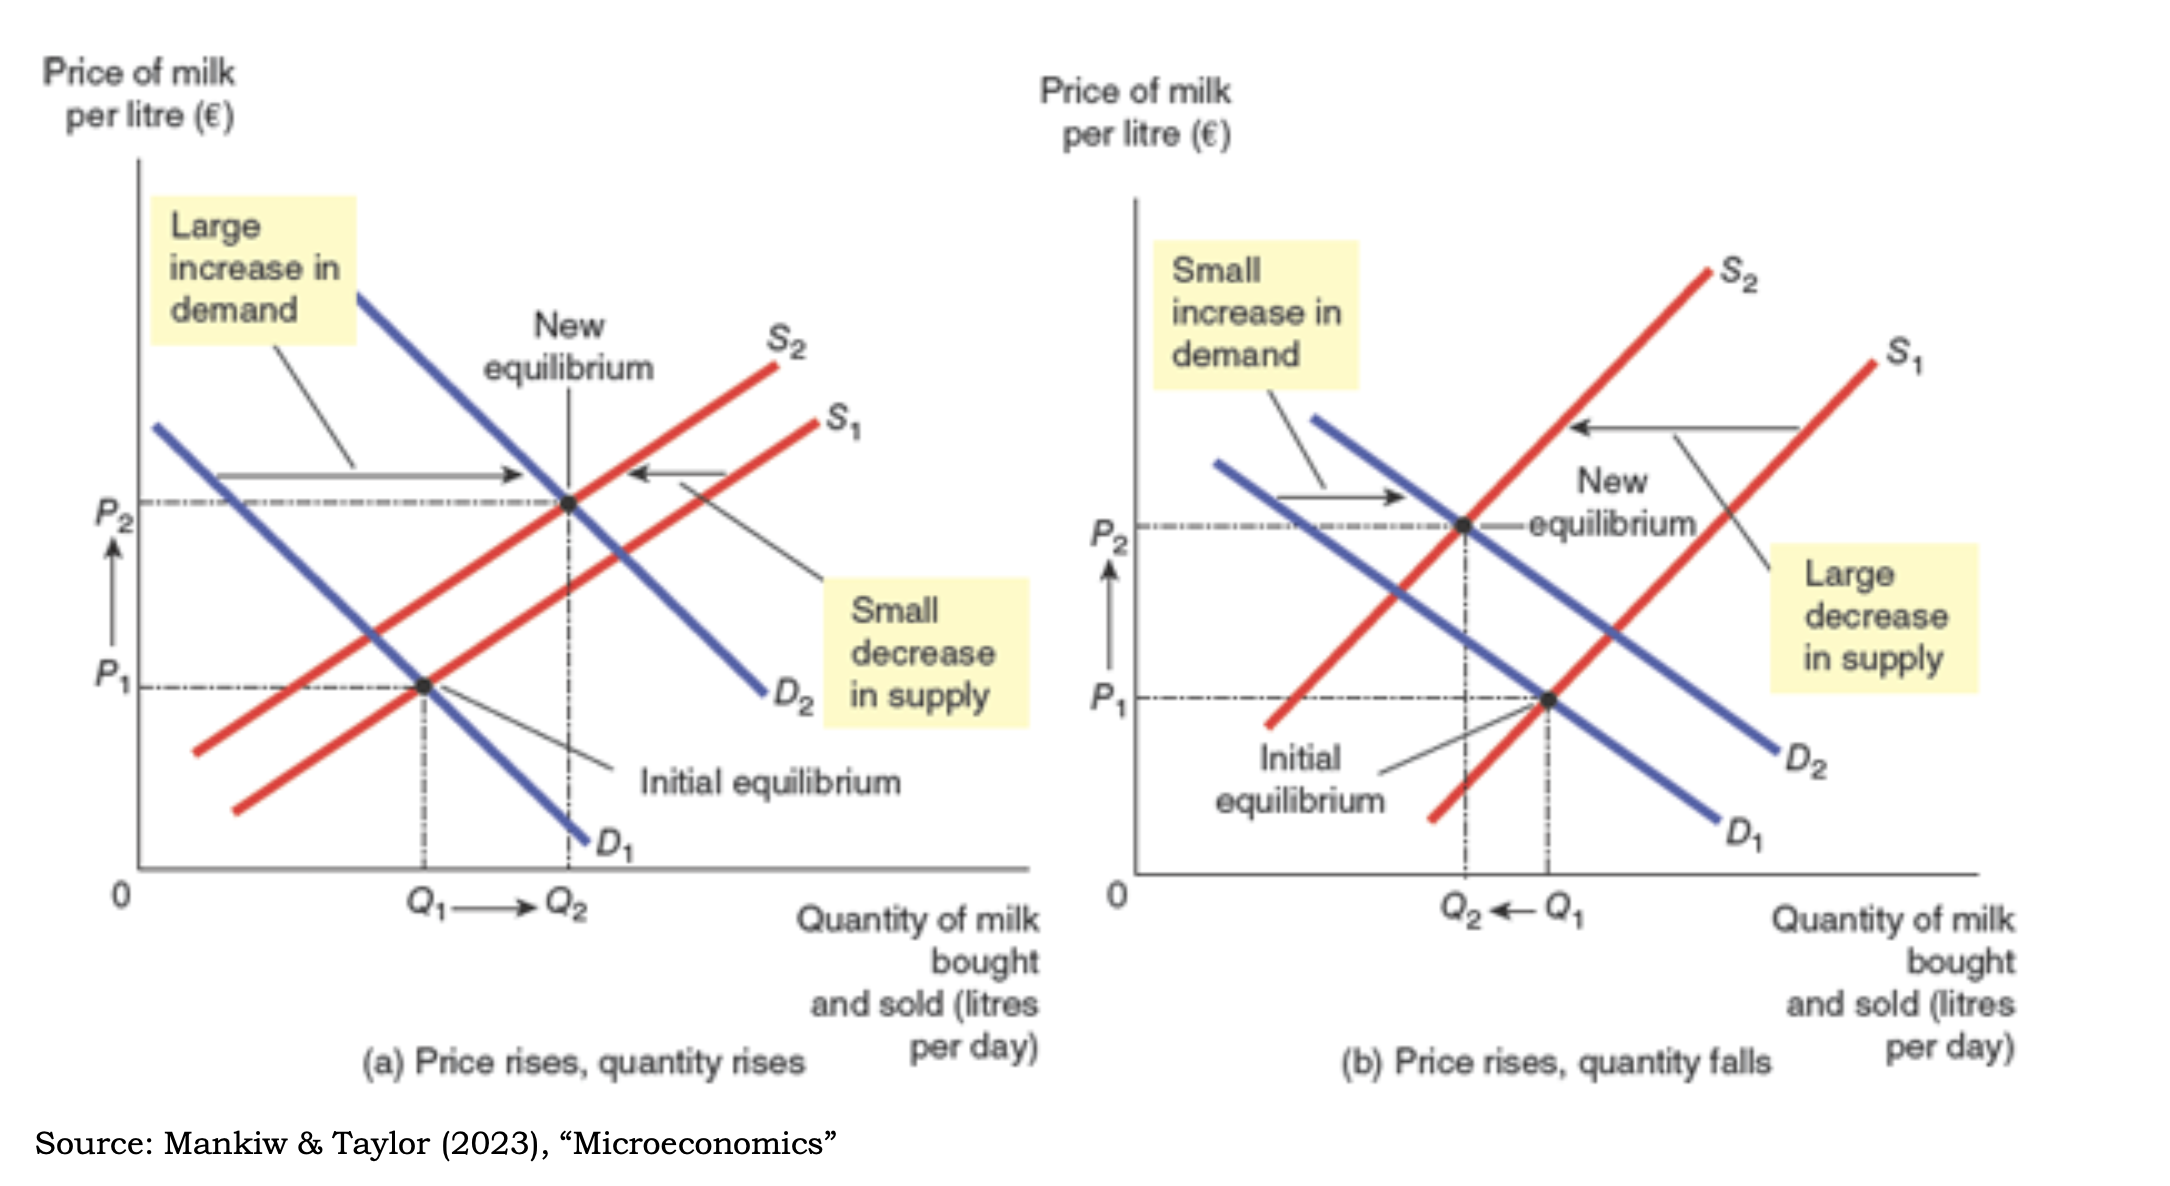
Shifts in the Demand and Supply Curve
The factors affecting a demand (price) curve can be represented as:
where is the price of the goods, prices of other goods, the incomes and tastes or fashions. In other words, a shift in the demand curve is cause by a change in a factor influencing other than a change in price .
The same applies for the Supply Curve .
Note that, for simplicity, we can say: price causes a movement on the supply/demand curve, everything else cause a shift.
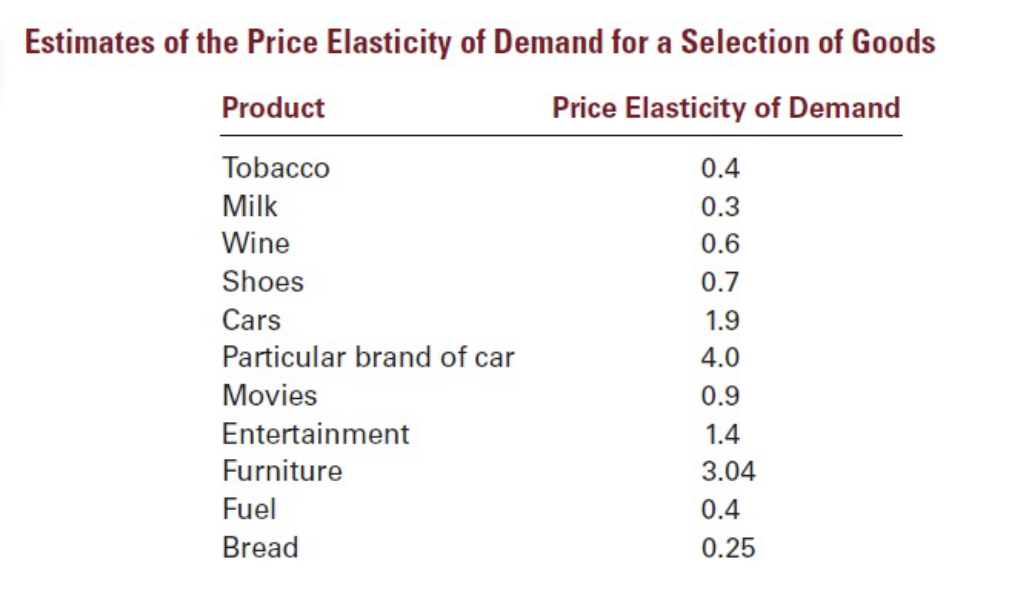
Elasticity
Elasticity is a measure of how much buyers and sellers respond to changes in market conditions.
Price elasticity of demand, for example, measures the change in quantity due to a given change in price, in formulas:
- Point Elasticity: measures elasticity at a specific point in the curve.
- Arc Elasticity: measures elasticity over a range of prices.
with averages on the range.
A similar definition can be given to Income Elasticity that measures the changes in the quantity bought depending on the income:
- Normal goods:
- Luxury Goods:
- Inferior Goods:
Usually, we also have that products with more substitutes have the more price elastic demand (more substitues => lower switching cost)
Also, if a unit change price doesn't have any effect on the market, we usually have a perfectly inelastic demand with a vertical demand curve (same applies for supply)
with vertical supply curve.
Cross Price Elasticity
Given two goods , , cross price elastiity is defined as:
- Complements:
- Substitutes:
- Indipendents:
Example: The Algebra of Price and Cross-Price Elasticity
Given the demand and supply quantity , the price and the product substitute price , find the absolute value of price elasticity of demand at the market equilibrium.
We firstly compute equilibrium:
We now compute elasticity as:
3. Elasticity & Theory of Consumer Demand: Neoclassical Perspective
The consumption of a certain good/service provides satisfaction to the consumer. Utility measures the level of satisfaction associated.
-
Early neo-classical economists believed that utility can be measured numerically _just like weight, temperature or distance.
-
Modern consumer theory states that utility cannot be measured numerically because is a subjective phenomenon.
Utility can also be measured in people's willigness to pay (WTP). The demands curve relflects the overall WTP for a good.
Budget Constraints
If we assume that buyers are rational and whant to maximize their utility (more is preferred to less), preferences and utilities cannot explain consumer behavior completely, reason why we need some budget costraints (limits on consumption bundles that a consumer can afford).
Given two goods , the budget line shows all the combinations which can be bought with a certain income :
Of course, an increase in the income (corresponding in a budget line shift to the right) means that the consumer can buy more goods of both , assuming that prices remain the same.
Indifference Curvers
Given two goods , an indifference curve represents all the consumption bundles that bring the same level of satisfaction (utility).
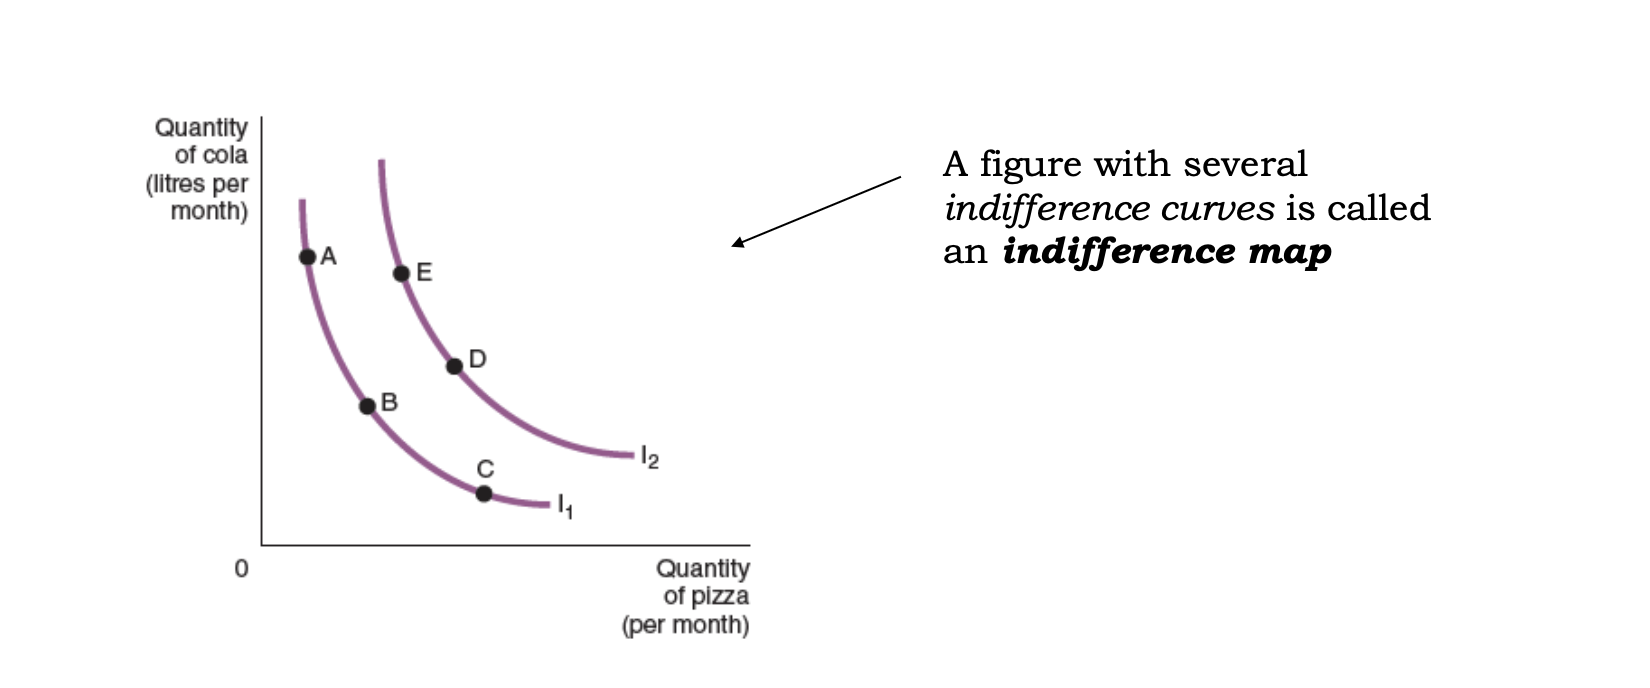
- Higher indifference curves (top-right) are preferred to lower ones.
- Indifference curves slope downward from left to right and are bowed inward.
- Indifference curves do not cross.
Also, we can recall the income e substitution effects:
- the income effect after a change in price moves the consumer to higher or lower indifference curve.
- the substitution effect after a change in price moves the consumer along an indifference curve.
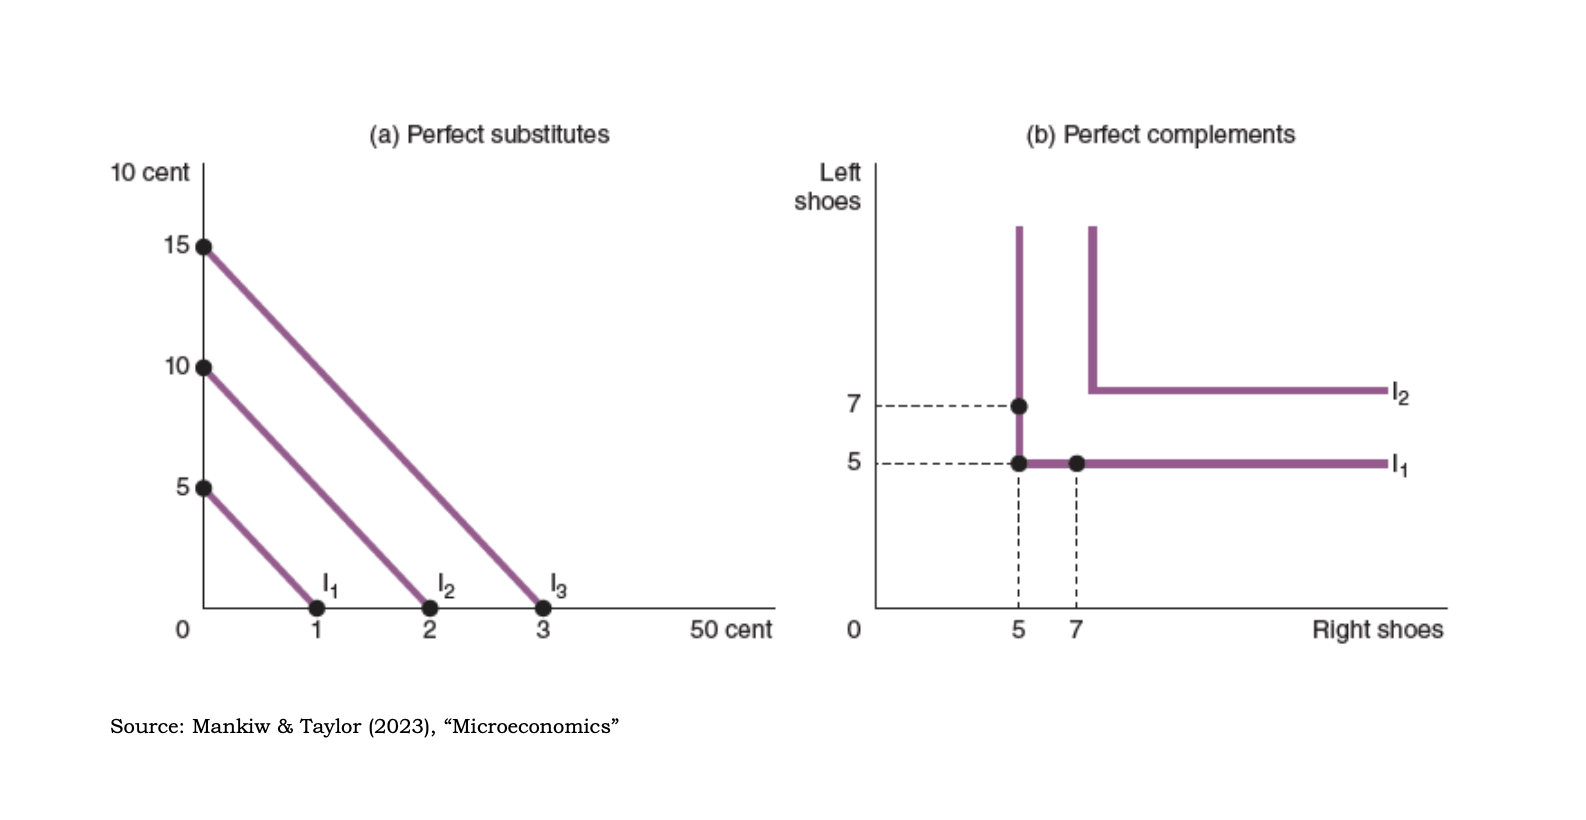
Perfect substitutes and complements show particular indifference curves.
Example: income and substitution effects with two goods
Initially, prices and quantities consumed by Giacomo are the following:
In a second period, price drops, resulting in:
We then know that, if Giacomo could change its income to maintain the same utility of the first period, quantities consumed would be:
The substitution effect measures the change in consumption caused just by the changes in price, keeping utility costant: . (Note that with the substitution effect Giacomo is moving along the same indifference curve same utility).
The income effect measures the change in consumption caused by the increase of purchasing power (for the price drop): . (Note that with the income effect the price change pushes Giacomo on a different level of utility).
The marginal rate of substitution (MRS) is rate at which consumer is willing to trade one good for another.
- It is equal in magnitude to the slope of the indifference curve
- High MRS represents an higher importance of the new good.
To represent the satisfaction gained from the consumption of a bundle , we use a utility function .
- assigns a number to each bundles of goods so that more preferred ones lead to higher numbers.
- Numbers don't have a intrinsic meaning, therefore we cannot compare two different utilites function.
Marginal utility is the additional level of satisfaction obtained from extra unit of good.
Usually, microeconomics assume that all utilities function have diminishing marginal utility.
Given two goods , the optimal consumption is obtained at:
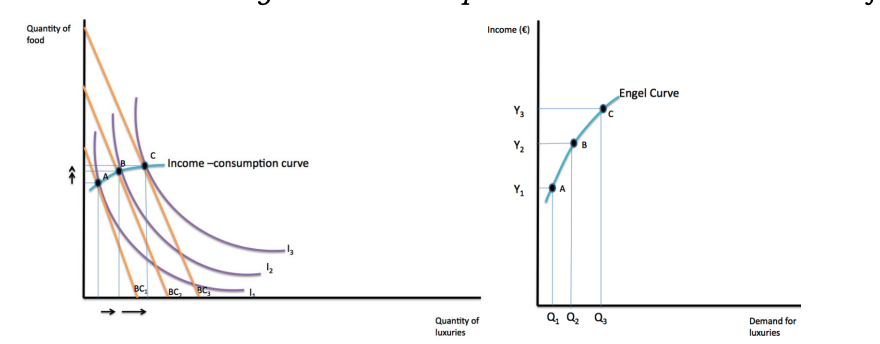
Price-Consumption, Demand & Engel Curve
The above graph shows that a decrease in price leads to a change in the consumer optimum (indifference curve). From this plot, we can derive the price-consumption curve and then the demand curve.
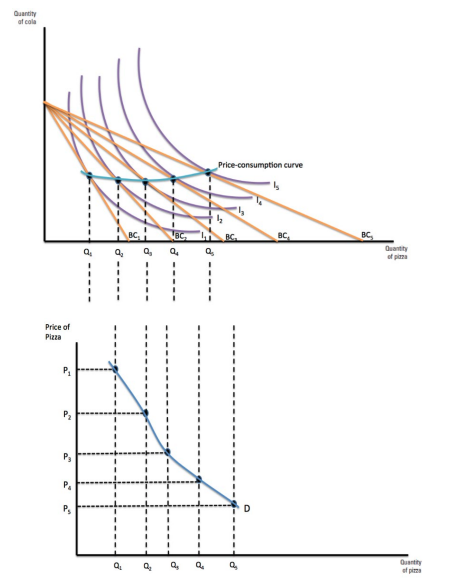
The Engel curve shows instead the relationship between demand and levels of income.
Behavioral Economics
Behavioral economics negectls some assumptions from the Neoclassical econmics, mostly by assuming that consumer choices are not always rational and utility maximizing. The most important behavioral anomalies affecting economic decisions are:
-
Bounded rationality
- Loss aversion (endownment effect: valuing an item more when you own it, status quo bias: preference for familiarity and resiste to change.)
- Framing (the way a choice is presented affects the decision.)
- Mental Accounting (threat money differently depending on its source or goal.)
- Intention Gap
- Bounded willpower (limited self control)
- Bounded selfishness
4. The Cost of Production
The production function is a simplied mathematical representation of the production process.
where, in this case repreent labor and capital. indicates the highest output that a firm can produce for every specific combination of inputs.
Normally, we distinguish between two periods:
- the short run, with variable and fixed
- the long run, with both variable.
The total product measures the total amount of output produced in physical units of measurement (tons, kWh...)
The marginal product of a production factor (MP) is the extra ouput produced as one input increased by one unit:
where is a production factor.
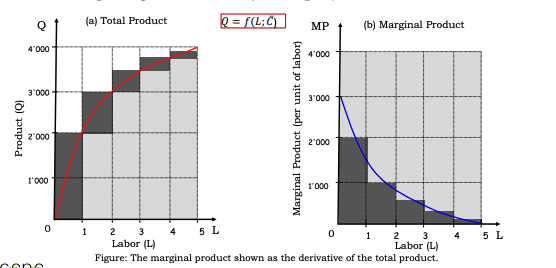
The diminishing (decreasing) marginal product property affirms that the marginal product of an input declines as the quantity of input decreases ( is decreasing function in ). Of course, it's not a law of nature, just an empirical principle.
Cobb Douglas Production function
A very widely used production function in economics is the Cobb Doublas Production Function, defined as:
where are costants. We also get:
Example: cost minimization problem with the Cobb Doublas Production function
The firm Jack Inc produces commodity using inputs labor and capital , with the following production function:
To solve the minization problem and obtain the optimal , we first need to solve the production function for :
we then substitute in the cost function:
we determine the cost-minimizing by taking the first derivative:
that brings to:
Productivity Indicators
A partial productivity indicator measures the firm's output in relation to a single production factor. For istance, labor productivity can be defined as .
The total factor productivity (TFP) can be defined as the ratio of total ouput to an index of total input:
TFP is generally used as a relative measured between different firms (countries) or the same firm (country) in different periods. The total input index is often defined as a linear combination of different production factors or other indeces.
The Tornqvist Index provides, using the TFP, an indication of the overall growth rate:
where is the revenue share, the output, the cost share and the cost share.
More about this index can be found here .Costs, Revenues, Economic and Accounting Profit
Generally, the economic goal of a firm is to maximize economic profit:
The cost of production also includes opportunity cost , that is the benefit or value of the most valuable good forgone or something the firm has to forgone in order to operate.
Cost of production can includes both:
- explicit costs: input costs that require directly paymnent of money
- implicit costs : they do't require outflow of money and they are not recorded in the accounting system. Opportunity cost, external and enviromental costs lie in this category
The distinction between explicit and implicit costs highlights another important difference between economic and accounting profit.
Other distinctions between the economic and accounting view are represented by deprecitation, sunk cost and costs related to negative externalities.
Cost of production can be further divided into:
- Fixed Costs: not determined by the quantity of output.
- Variable Costs : dependent on the quantity of output.
Note that, for many firms, the distinction between fixed and variable depends on the time horizon being considered: in the long run, fixed costs become also variable.
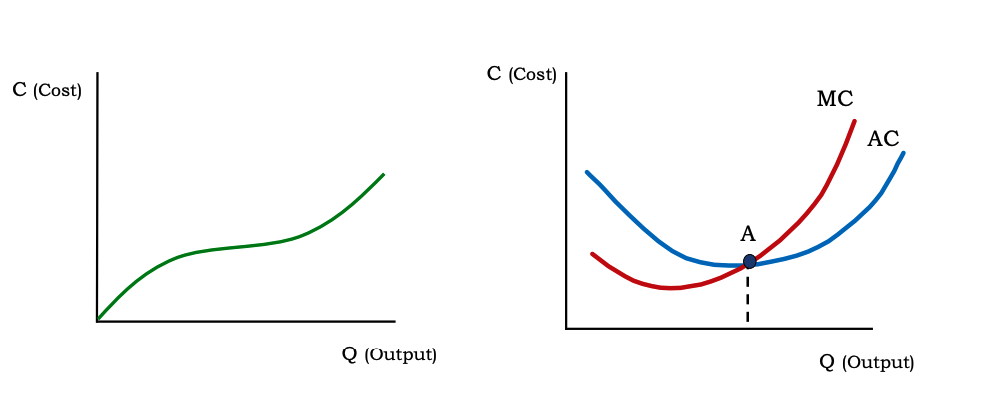
We can then define:
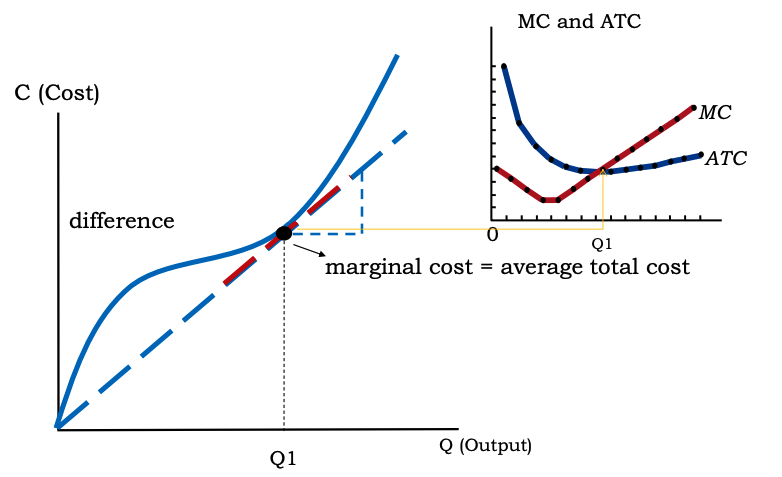
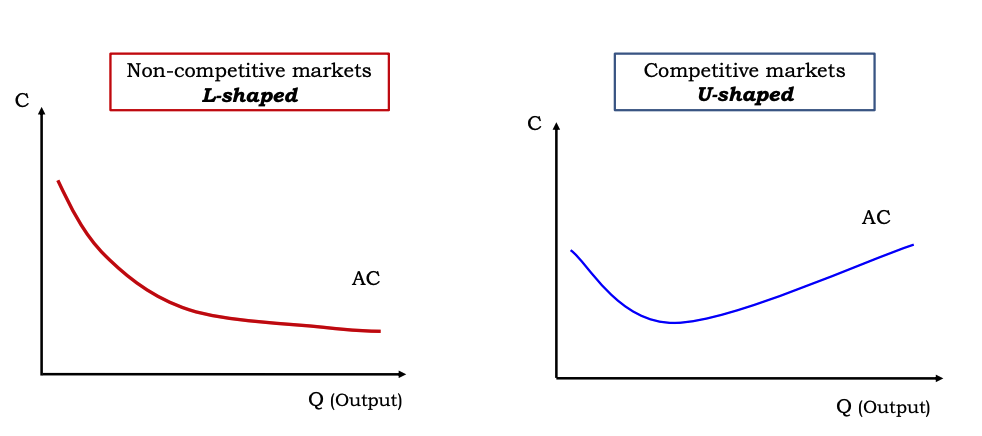
The shape of the total cost curve is stricly dependent on the market type.
Economies of Scale
- Economies of scale refer to the property for which the long-run average total cost falls, as the quantity increases due to:
- Large initial investments in production capacity.
- Transaction cost does not increase with output.
- If the firm operates at scale, workers can specialize where they are more productive.
- Diseconomies of scale refer to the property for which the long-run average total cost rises.
- Costant returns to scale (CRS) refers to the property for which the long-run average total cost remains costant.
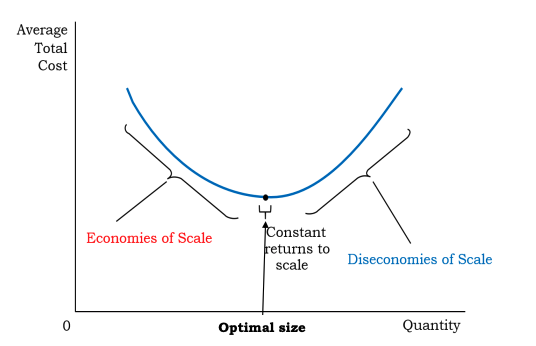
We use to measure the previous attributes:
- : economies of scale
- : diseconomies of scale
- : CRS
Economies of Scope
If the joint production of a single firm is greater than the output it could be achieved to different firms, each producing a single product, we speak of economies of scope.
In other words, if the cost of producing different output by one firm is lower than the aggregated cost or producing the same output in separated firms, we speak of economies of scope.
Economies of scope works because joint production allows to alloca resources in a more productive way, there's a better load factor on machine (higher saturation) and labor and there's risk diversification in R&D.
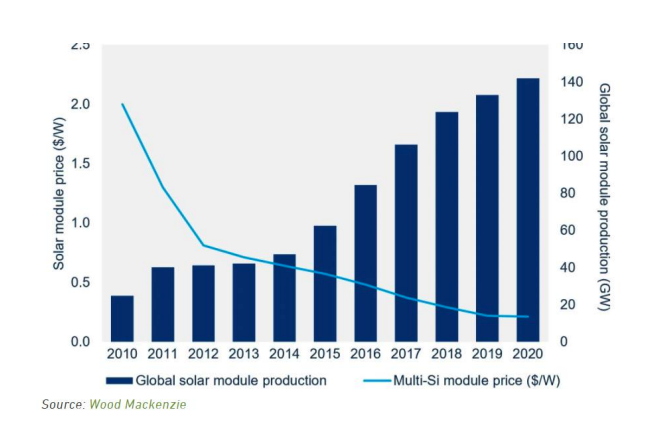
Economies of scope are often represented with a downward learning curve :
5. Theory of Cost, Consumer & Producer Surplus
Isoquants
A isoquant is a function representing all possible combinations of factor inputs (such as labor and capital) that can be used to produce a given level of output. Perfect substitutes and complements show particular isoquants curve.
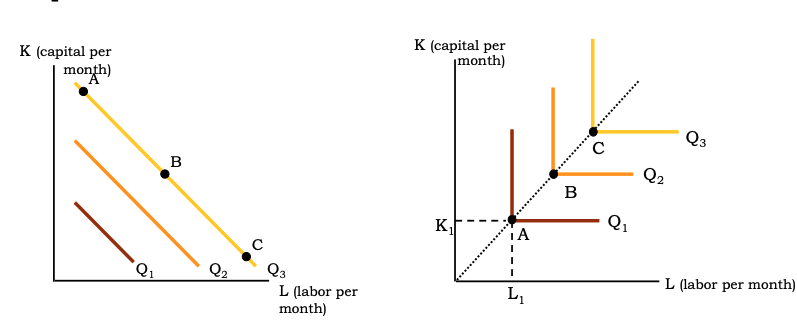
From the isoquants, we can define the marginal rate of technical substitution (MRTS) as the rate at which one factor input can be substituted for another, given a level of output.
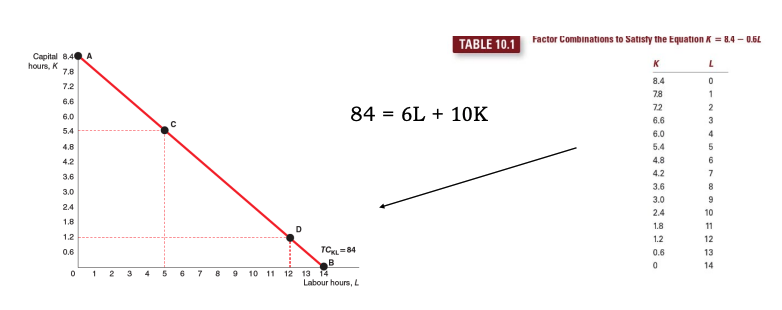
Isocost Line
The isocost line shows the different combinations of factor inputs that can be purchased with a given budget.
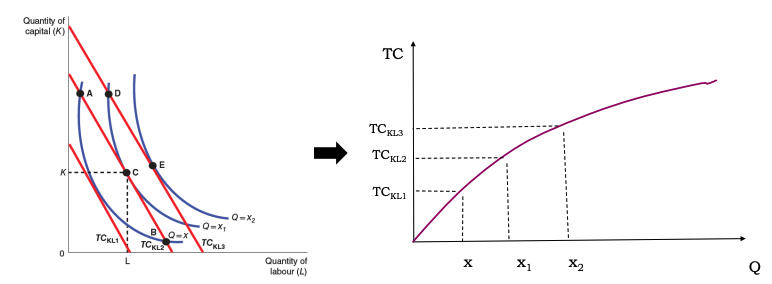
Derivation of the Supply Curve
We then see that if we move to the top-right we increase output but, looking at the tangency between the isocost line and the isoquant line, also the total cost increase. Therefore, by combining the plots and plotting quantity and total cost, we can derive the supply curve .
Inefficienties and the Principal Agent Problem
The previous derivation is based on the assumption that prices were always fair and there are not inefficienites, which in realy there are.
The Principal Agent Problem is a typical example: it occurs when there's a conflict of interest between the owner (the principal) of the firm and the management or the firm as a whole (the agent). Often indeed, there's an asymetry of information between the management and the owner, leading to actions more in favour of the management than the owner that can bring cost inefficienities.
7. Consumer, Producer Surplus & Welfare Analysis
Consumer and producer surpluses are used to measure the change in welfare due to a change in the market conditions.
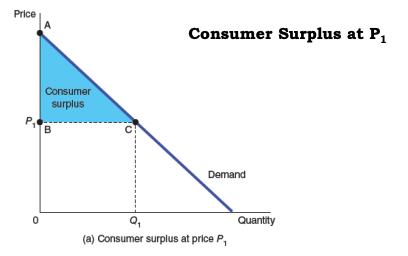
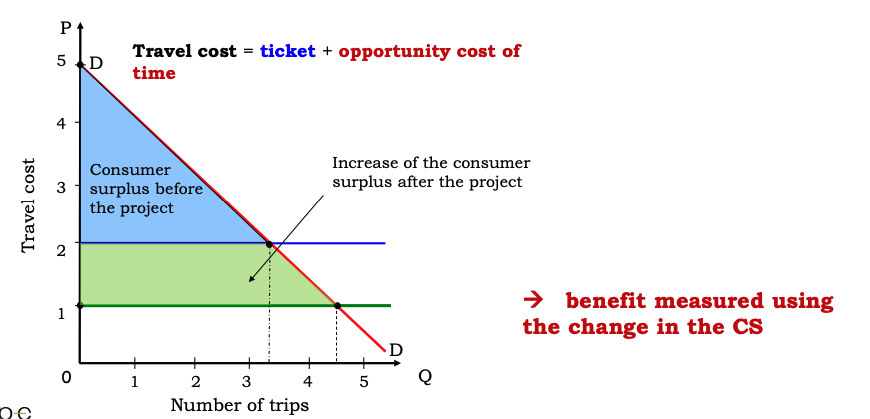
The consumer surplus is the buyer's willigness to pay minus the amount the buyer actually pays; it measures the extra amount of value in $ the consumer receives.
It increases as the price decreases.
Consumer surplus is calculated as the area below the demand curve and above the price.
The consumer surplus may be useful to evaluate the benefits in the evalutation of a public investment (or similar) since it measures the increase of value for the final user based on the price paid. Think, for example, at the cost-benefit analysis of the construction of a tunnel for a railroad.
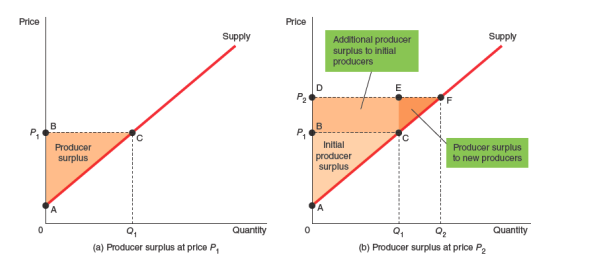
The producer surplus is the amount a seller is paid for a good minimum the seller's cost or, in other words, it is the excess of revenues over long run cost of production.
It decreases as price decreases.
Producer surplus is calculated as the area above the supply curve and below the price.
Total surplus (TS) is defined as the sum of both of them.
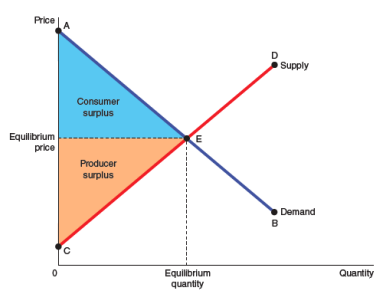
Deadweight loss is instead the loss to the society because the market is not producing at its most efficient level.
It is found as follow:
- compute the initial equilibrium
- find the new equilibrium given by an efficient
- the deadweight loss is calculated as the area of the triangle obtained by:
- the demand curve (top side)
- the supply curve (bottom side)
- the vertica line .
This area is almost always a triangle/arrow pointing to the initial/optimal equilibrium.
6. Market Failures & Behavioral Anomalies
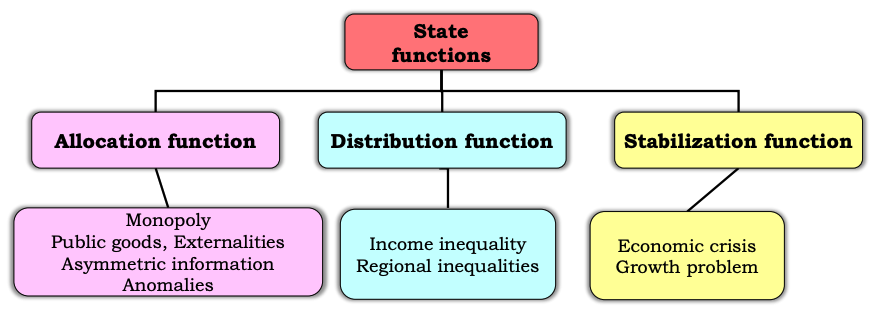
There are several reasons behind the imperfect functioning of the market:
Caused by efficiency:
- public goods and commono resources
- externalities
- imperfect competition
Caused by equity:
- income and wealth inequalities
Caused by macroeconomics:
- unemployment and inflation
- behavioral anomalies
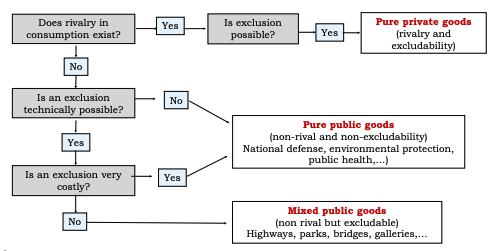
When thinking ad public and common goods, it is useful to cluster them according to two characterics:
- excludable refers to the property of a good that can be used only if the person pays for it.
- rival refers to the property that one's used siminishes other people's use.
In presence of free goods (both common and public), the market system will not supply any of enough of these goods, in such cases, the goverment policy has to eventuallty remedy the market failure.
The Free Ride ProblemThe Free Rider represents a person that receives the benfits of a good but doesn't pay for it.
- In this case, the goverment can decide to provide or support the supply of the good if the total benefits exceed the costs.
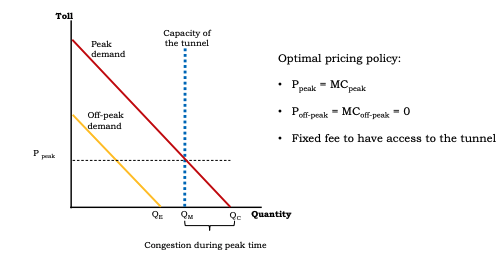
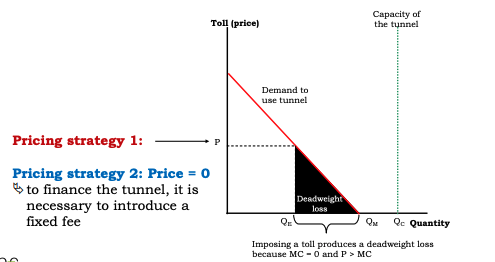
- The goverment can increase the welfare by providing the public good and paying for it with a tax revenue or by introducing a fixed feed for the users.
To understand the demand for a public good, we firstly start by calculating the aggregated demand, obtained by in the chart, by summing vertically each single demand line. Then, as usual, the optimum is found at the intersection between the marginal cost and the aggregated demand.
Then the question is, in presence of public goods, how to price them?
The identfication process of public and private goods:
Common resources are instead free of change to anyone who wants to use them and they are rival because one's persone use reduces others' use, leading often to overconsummption and then inefficienties.
The overconsumption problem can lead to the depletion of the common resource, therefore a situation where everybody loose: in economics this problem is called the Tragedy of Commons .
Some possible solutions are:
- the governement direct intervention
- privatization of the resource by assigning property rights
- self-organizazion
- Elinor Ostrom (common resources are well managed when those who benefit from them are in close proximity with the resource)
Externalities
An externality is a cost or benefit resulting from an economic activity or decision that affects a third party who did not choose to incur that cost or benefit. Because these effects are not reflected in market prices, the decision-maker does not take them into account.
Externalities (positive or negative) can cause market inefficienites and thus fail to optimize total surplus.
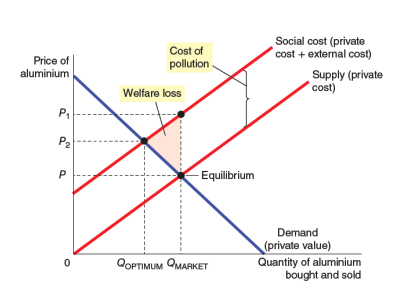
From a microeconomics point of view an externality is a cost not reflected in market price, then we have to quantify and monetize the acual cost (damage cost approach) and calculate a new Social Cost .
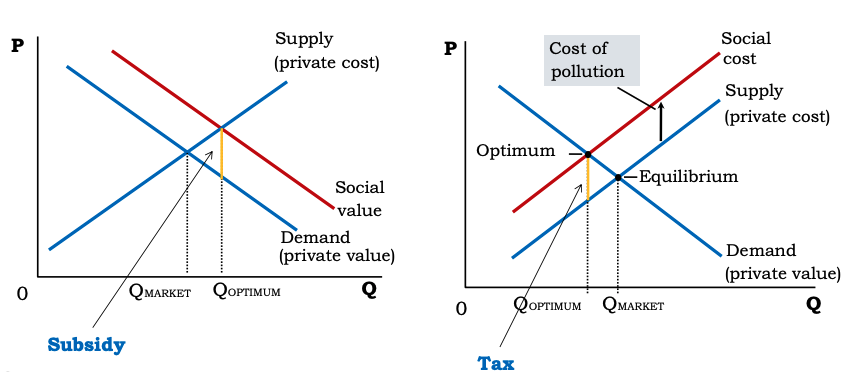
Negative externalities are the cost of a decision imposed on a third party.
In this case, the social optimal level is less than the market equilibrium (increased cost caused by the external one)
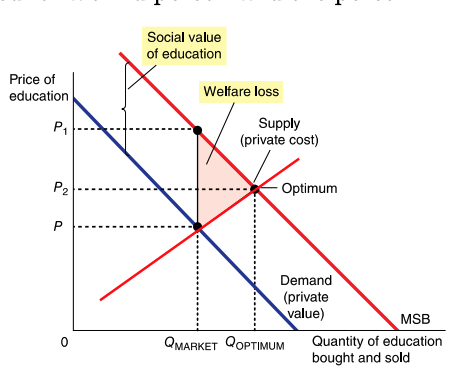
Positive externalities are benefits created for a third person, with the that person not paying for the benefit.
In this case, the market produces a smaller quantity than what is socially desiderable and them the social welfare of the good exceeds the private value of the good.
The state intervetion can be grouped as:
- traditional regulation (emission limits, technology standards etc)
- economic instruments/market based-policies (enviromentaltaxes, subsidies etc)
Internalizing an externality means introducing incentives so that people take into account the external effects of their actions.
- Taxes: in case of negative externalities the governement can impose a Pigovian Tax on the producer to reduce the equilibrium quantity.
- Subsidies: used as a method do internalize positive externalities.
- Asymmetric information can lead to an inefficient outcome because sellers (buyers) can take advange of buyers (sellers).
- In this scenariom, moral hazard is a situation where an economic agent takes an higher risk because the coust that could incurr would be covered by a third party.
- The Too Big to Fail problem : a situation where a firm is deeply integrated in the system thatn its failure would be disastrous to the society.
- Income and wealth inequalities: competitive markets can indeed result in:
- individual wealth and income inequality (the Gini Coefficient is a measure of the degree of the income inequality in a country: 0 = total income equality, 1 = income is concentraded in one person) .
- regional wealth and income inequality.
- Merit goods:provided by thee market but may be under-consumed as a result of imperfect information about the private as well as the social benefits at the time of consumption (education, healt care, postal services...)
- Merits good are offered by the public sector because of the assumption that consumption is desired by society.
8. Public Sector & the Tax System
Government Spending
Public revenues are defined as the sum of all available resources to the public sector to finance national expenditure and subsidies. They come from:
- Sale and leasing of public goods
- Contributions:
- Taxes (obligatory widhdrawal, not for a specific service)
- Fees (obligatory contributions for specific services)
- Loans/Bonds (not venures in the original sense)
- to produce public and merit goods
- to contribute to the income equal distributiion process
- to reduce negative externalities (eco-tax, fat-tax... etc)
There are several type of taxes:
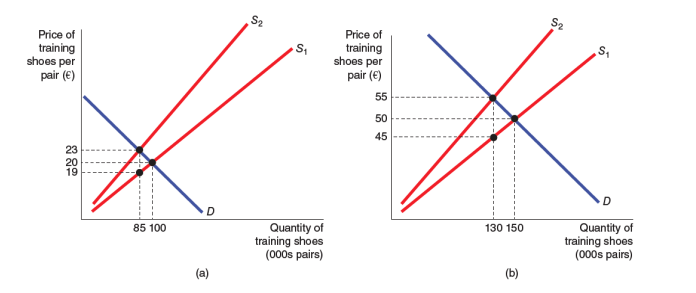
- Direct/Indirect Tax : levied on income or on the sale of a good (VAT)
- Specific/Ad Valorem Taz : fixed amount tax or based on the price of the good (chart below).
Furthermore:
- Income Tax is a tax levied on the income.
- Lump Sum Tax is a tax of the same amount for every people.
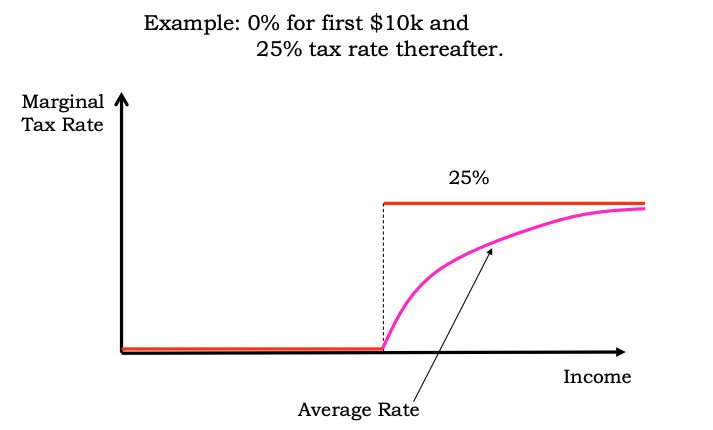
Them, the average tax rate (ATR) is defined as:
The marginal tax rate (MTR) is instead the extra amount of money paid on additional unit of income.
If the marginal tax rate is costant, we then have a flat tax (also called proportional tax).
If the marginal tax rate is an increasing function, them we have a progressive tax.
In many tax systems, there a tax free allowange: under a specified threshould of income, the average taxe rate is .
An efficient tax system tries to minimize the costs to taxpayers and the government, that are:
- administrative burden on both sides
- deadweight loss in case of competitive markets (people alloca resources based on the tax incentive rather than the true cost or benefit of a good.)
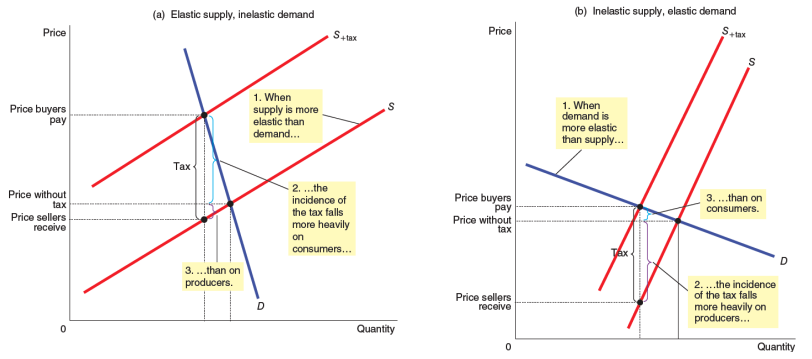
Tax incidence is the study of who bears the burden cost of taxes, that always result in a change in the market equilibrium (buyers pay more and sellers receive less, regardless on who the tax is imposed to).
Price elasticity determines how much the tax burden affects a market:
Taxes and Equity
The basic question when desigin a tax system is: how should taxes be distributed among the population?
The are 2 basic principles:
- Benefits Principle: people should pay taxes based on the benefits they receive from the State.
- Ability to pay Principle : taxes should be levied on a person according on how well the person can resist to the burden. This definition leads to 2 further related notions:
- Vertical Equity: the idea that wealthier taxpayers should pay larger amounts.
- Orizontal Equity: tax payers with similar abilities to pay taxes should pay the same amount.
9. Firms in Competitive Markets
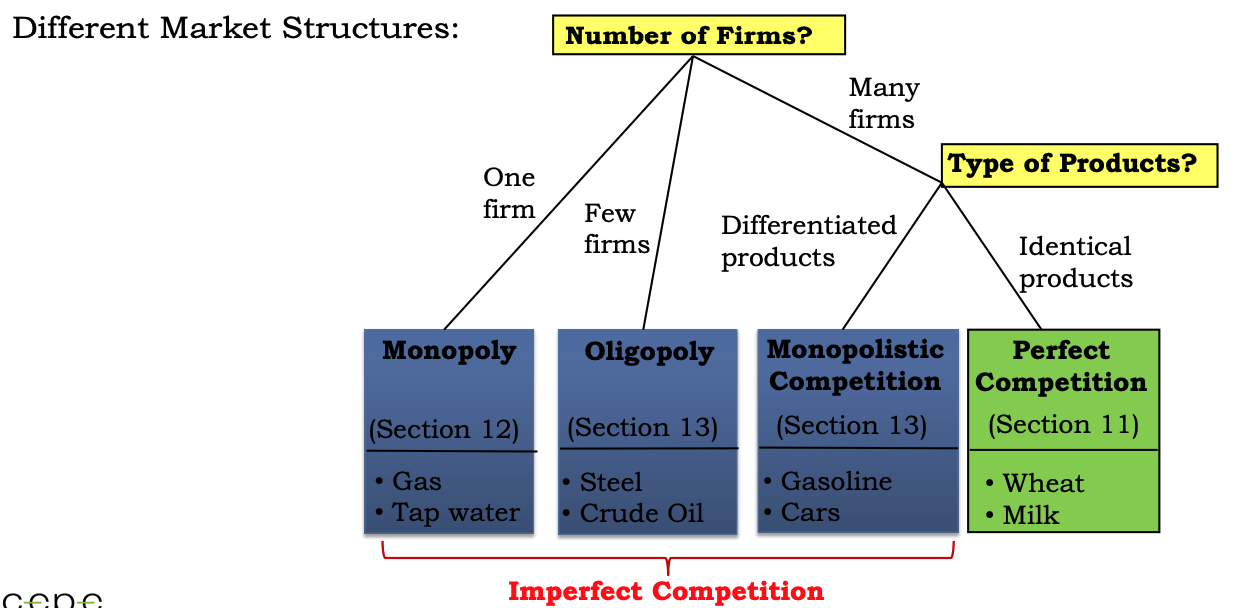
A perfectly competitive market has the following properties:
- many buyers and sellers
- firms are price-takers (firms have no power to influence the price, they accept the equilibrium price given by supply and demand)
- homogeneous goods
- firms can freely enter or exit the market
- no externalities
- perfect and complete information
- economic agents are rational
A market like that results in perfect equilibrium and maximum welfare.
A Competitive firm's goal is to maximise its profit, producing in a efficient way to minimize costs and with a long term visition to maximise the market value of the firm.
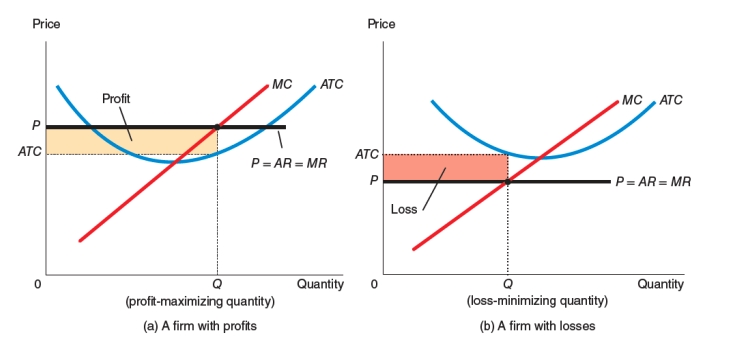
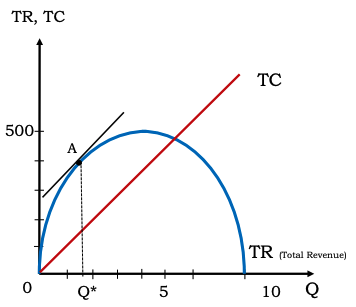
The following charts show the equilibrium conditinos:
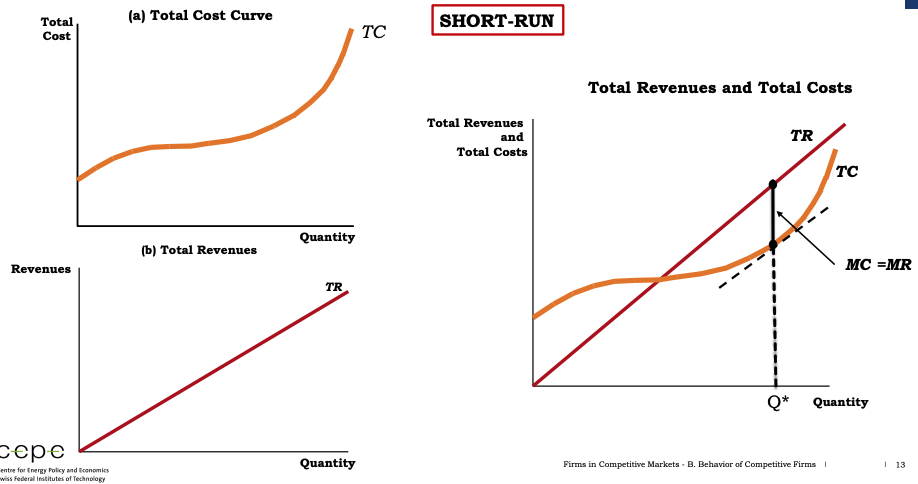
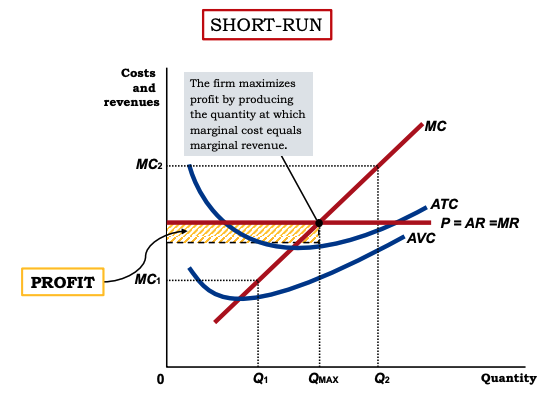
The profit maximizing condition is:
and, in a competitive market, we have:
Therefore, the profit-maximizing condition rewrites as follow:
This conditions implies that a firm's marginal cost curve describes also it's supply curve.
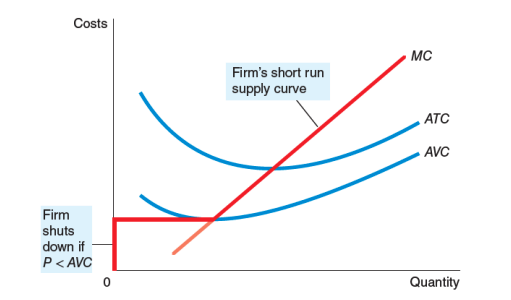
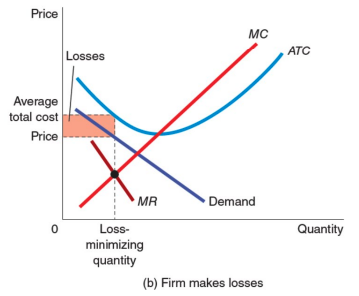
As long as revenues minus variable costs () cover the fixed cost partly, the firm should produce until .
If instead the prices such that , the firms minimizes its loss shutthing down the production.
The critical market price (Shutdown point) is the point such that:
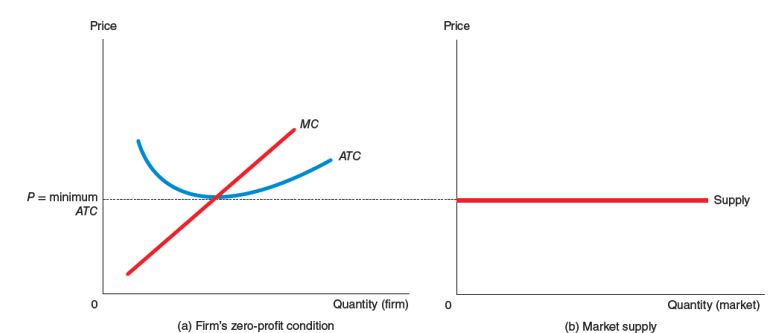
In the long run, firms behave differently:
In the long run, assuming again a market supply with entry and exit:
- firms move in and out until profit is driven to zero .
- in the long run,
- the long run market supply curve is horizontal and equal to .
Additional theories: a behavioral theory of the firm
- Firm has several goals
- Firm's behavior is satisficing rather than maximizing, so it looks for levels of profits, sales, rates of growth that are "satisfactory"
- Behavior characterized by "bounded" or "limited" rationality
- Firm is an organization made up of agents with different goals and incentives
- Management look for a compromise that is satisfactory for all members of the company
10. Monopoly
A monopoly occurs when a firm is the sole seller of a product without close substitutes. Market Power is the ability of a firm to raise the price and not lose all its sales againts rivals.
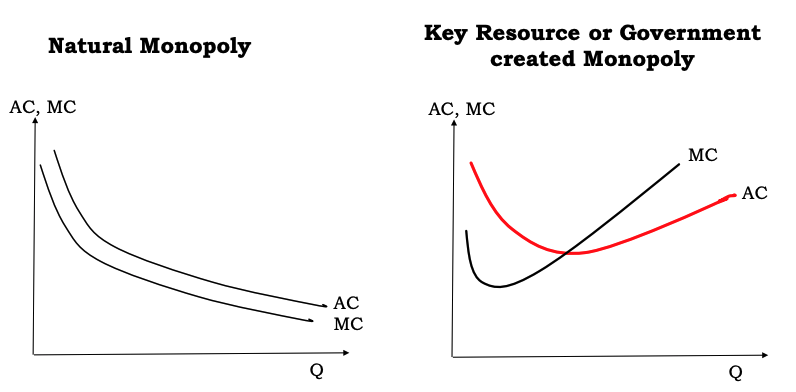
The foundamental cause of monopoly is the presence of barries to entry, caused by:
-
strategic resources owned by a firm
-
the governement gives a single firm the exclusive to produce/sell a good throught:
- patents: the exclusive right to use a technology for a fixed number of years (usually 20, depending on the law)
- copyright: the right to own and momnetize things a firm created.
-
Natural monopoly: cost of production makes a single large produver more efficient than a lot of smaller ones (economies of scale, example: distribution of water)
The key differenct between a competitive firm and a monopoly is the ability of latter to influence the prie of its output.
| Monopoly | Competitive Firm |
|---|---|
| Sole producer | One of many producers |
| Downward-sloping demand curve | Horizontal demand curve |
| Price Maker | Price Taker |
| Reduces price to increase sales (lower price leads higher quantity sold, downward demand) | Sells as much/as little as the same price (given the flat demand curve) |
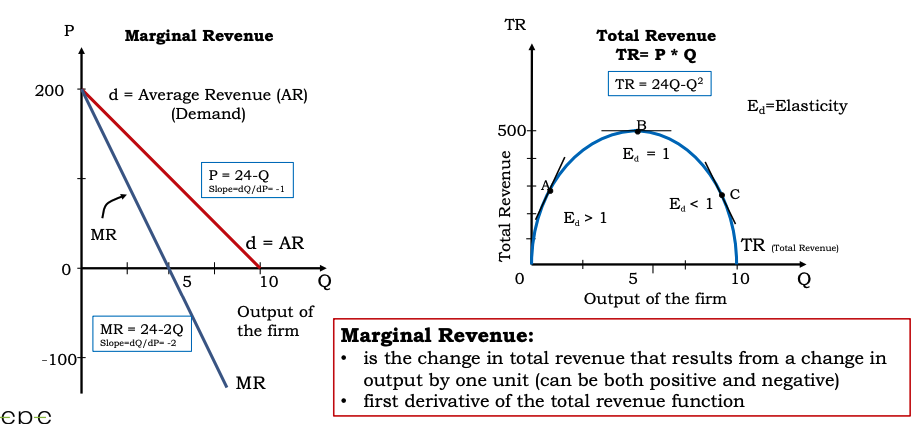
When a monopolist increases his sales:
- output effect: more output, then higher .
- price effect: the price falls, then lower .
- the impact on total revnue depends on the value of the price elasticity.
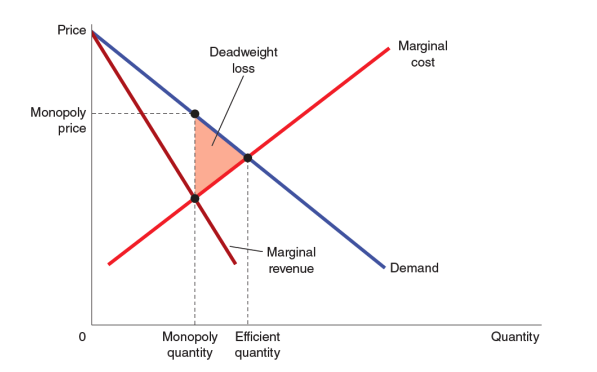
Given the downward demand curve:
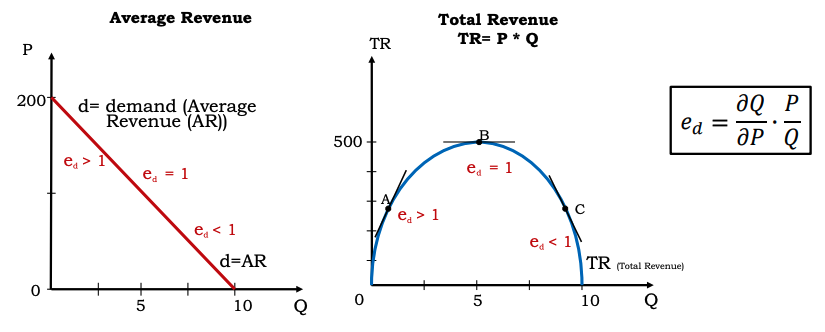
The equilibrium quantity is obtained at (that is when the slope of is equal to the slope of )
The equilibrium price is then obtained using in the demand function.
We also have that:
so, for a monopoly, price is greater than marginal cost :
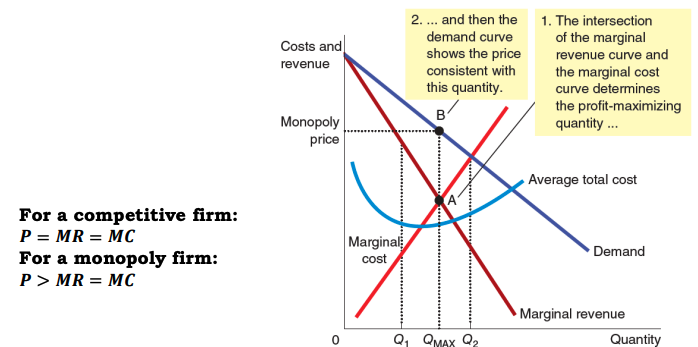
Before , a monopoly sets a gap between the consumer's willigness to pay and the producer's cost, that causes the quantity sold to be less than the social optimum (inefficienty).
The firm Maggiore GmBh acts a monopoly in the running shoes industry and faces the following demand curve:
where is weekly production, price, in per unit.
The firm cost function, without the tax, is given by:
Assume that Maggiore GmBh maximises profits.
If the government decides to levy a tax of 13 cents per unit on this product, what will be the tax revenue raised (in cents)?
To solve the problem, we first compute the cost function including tax as:
with is the tax per unit.
We then compute profits as:
To find the proxit maximizing , we take the first derivative:
The total tax revenue is then:
Price Discrimination
Price discrimionation is the practice of selling the same good at different prices to differenct customer (only possible if there are not arbitrage opportunities).
- it's a rational strategy for profit maximization
- it requires the ability to cluster customers according to their WTP, geography, wealth, utilities etc...
- it can raise the economic welfare due to the higher producer surplus (given by higher profit)
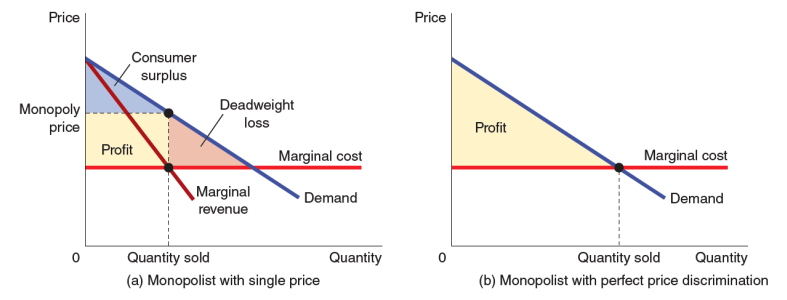
- Without price discrimionation the firm charges a price that creates a deadweight loss because people that value the product more than its cost () don't buy it.
- With price discrimionation the firm charges every customer a price according to their WTP.
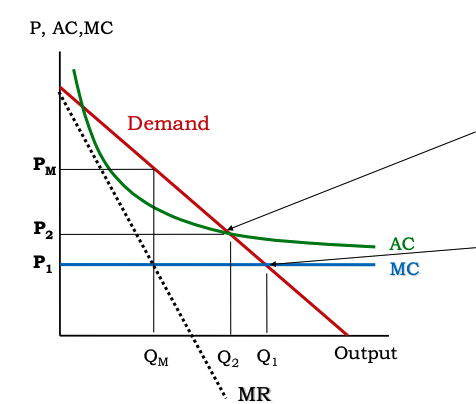
Price regulation in a Natural Monopoly
It consists in a limitation of a monopoly profit by imposing on of the following tariff policies.
- (first best): efficient pricing, socially optimum (no waste), but the firm registers a financial loss
- (second best): fair-return pricing, the firm makes zero profit but there's still some deadweight loss
- , the price is (unregulated): the firm makes high profit, large deadweight loss.
11. Monopolistic Competition
Monopolisitc competition refers to the scenario in which many firms sell products that are similar but not identical.
- many sellers competing for the same customers
- each firm produces a product that is slightly different from the others, each firm faces a downward demad curve
- free entry and exit
- the cross-price elasticites are large
In the short run, momopolistic competition and monopoly behave similarly.
Short run economic profits (given by ) encourage new firms to enter the market, leading to:
- increased number of firms
- reduced demand faced by firms already in the market
- old monopolisitc firms' demand curve shift to the left
- demand for old monopolisit firms fall and their profits loss
The short-run economic loss encourages the firms to exit the market, leading to:
- decreased numbers of products offered
- increased demand faced by a single firm
- shift of the remaining firms' demand curve to the right
- increased profits for the remaining firms
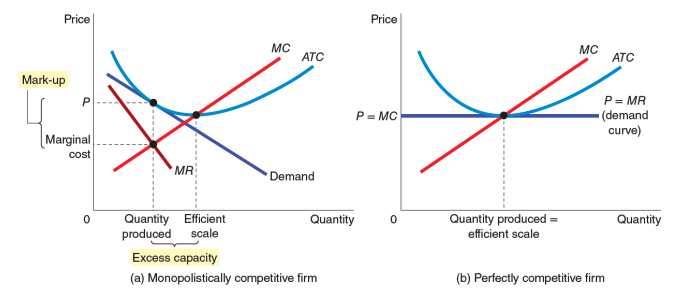
There's an important difference between monopolistic and perfect competition:
-
in perfect competition, each firm produces the optimum quantity at the optimum price ()
-
in monopolistic competition, price exceeds marginal cost (), leading to:
- a mark up on prices (firms have unique products and then they can charge about marginal cost)
- an excess capacity (the quantity produced is less than the most efficient one at scale because this leads to higher profits).
Advertising
When firms produce differentiated products above marginal cost, they have an incentive to advertize their products to attract more customers. (Firms with highly differentiated consumer good usually spend of revenue on advertizing).
Common critiques of advertizing are:
- advertizing can lead to people's tastes manipulation
- advertizing limits competition by implying that products are more different than they actually are
- advertizing plays an important role in shaping a consumer society with high ecological footpring
Common defences of advertizing are:
- advertizing provides more information to customers
- advertizing improves competition by offering greater variety of products and prices
- the WTP of a firm to spend in advertizing can be a signal to customers about the quality of the products
A consumer society is defined as a society in which customers do not buy good for primary important or need, but also because shoping is an integral activity of everyday life, influencing how people perceive themself and interact each other.
Consumerism is defined as the habit of purchasing items of secondary importance, superflous, and in large quantities.
12. Oligopoly & International Trade
Oligopoly occurs when there are only few sellers, each offering a ssimilar or identical product.
- small number of firms that control the market (high concentration ratio, the main difference between monopolistic competition)
- product differentiation may not exist
- barries to entry
- high concentration
- interdependence: each firm has some influence to others.
Concentration Ratio across different industries :
| Industry | Largest 4 firms | Largest 8 firms | Largest 20 firms |
|---|---|---|---|
| Motor vehicles | 90% | 97% | 100% |
| Sugar | 99% | 100% | 100% |
| Cigarettes | 95% | 99% | 100% |
| Soft drinks | 48% | 64% | 82% |
| Retail (food) | 53% | 71% | 88% |
| Bakeries | 41% | 51% | 65% |
These industries in general show:
- prices are much higher than marginal cost
- more advertizing
- high expenditure on R&d
- profits are systematically highter than the average
In a oligopoly market when firms aim to maximize profits, they produce quantity greater than the one produced in a monopoly but less than the one produced in perfect competition.
The opposite happens with prices:
Total profits are less than the monopoly profits.
Another key difference between oligopoly and competition is that, in the latter, firms do not take into account the rivals' response when choosing output and price. In a oligopoly instead, firms have to consider the response of competitors (game theory).
There are two different models for oligopoly competition:
- Cournot Model: firms produce homogeneous goods, each firm treats competitors' output as fixed, all firms decide simultaneously what quantity to produyce (quantity competition).
- Stackelberg Model : one firm sets its output before the others do (quantity competition with a firs-move advantage).
- Bertrand Competition : firms produce homogeneous goods, each firm treats competitors' output as fixed and all firms decide simultaneously what price to charge (price competition).
Examples: Competitive Market vs Cournot, Bertrand and Stackelberg Models in a duopoly
Suppose a town with two firms, producing potable water. Suppose, in a competitive market, a demand curve given by: and .
Total revenues are given by:
Differentiating to obtain :
We then set to find the equilibrium quantity :
In a monopoly market therefore, we would obtain and, substituting in the demand and revenue function:
In a Cournout Duopoly , if we define quantities produced by firms and we set their marginal cost to zero again, we can compute again the market demand can be rewritten as follows:
The profit functions are:
Each firm maximizes profits by setting the derivative to zero.
Since the firms are identical, we set , that brings to:
- The total output is then
- The market price is
- Profits per firm are
(Confirming what we said before about quantity produced and price set in a oligopoly)
In the Stackelberg model ; we keep the same startgin assumptions, , with , and . We then define firm as the first mover, while firm follows.
To solve the equilibrium, we start from the end: firm observs quantity produced by and maximises his profits (same as Cournot):
Differentiating and setting to zero:
Leading to firm 's reaction function .
Unlike in the Cournot model , firm know how the follower will react, so moves in advance substituting 's reaction function in his profit function:
Now firm can maximize his profit setting the derivative to zero:
We can now find quantity produced by firm by substituting in 's reaction function:
That leads to a market price of:
- The total output is then
- The market price is
- Profits per firm are
- Profits per firm are
We can easily notice that, being the first-mover, firm has significan higher profits than and that, since , there are still some inefficienties in the market.
In a Betrand competition model , firms compete on price. We then start from the initial starting assumptions: (that can be rewritten as ) and for both firms.
The logic behind Betrand competition is that:
- if : firm captures all the demand: and (the opposite also applies)
- if : firms equally split the market:
Therefore, the profit function is:
In this scenario, each firm has an incentive to cut prices to capture the market until ( in this case). We can then conclude:
- The market price is
- The total quantity produced is , with
- Total profits are
This leads to a situation with total market efficiency.
Cooperative Behavior in a oligopoly
In a oligopoly (duopoly) firms may agree on a monopoly outcoome:
- a collusion is an agreement among firms about quantities to produce or prices to charge
- a cartel is an organization of independent firms which decide to coordinate their activies explicitly.
If oligopolists organize themself to maximize profits with respect to the implic collusion, price and output are the same as in a monopolistic market.
For a cartel, an inelastic demand means that the cartel can set an higher price (and then higher profits). However, collusion and cartels are prohibited by law (the breadkdown of cartels result in higher consumers's welfare).
Game Theory
Game theory is the study of how people behave in strategic situations when they have incomplete information .
Strategic decisions are often represented in a payoff matrix.
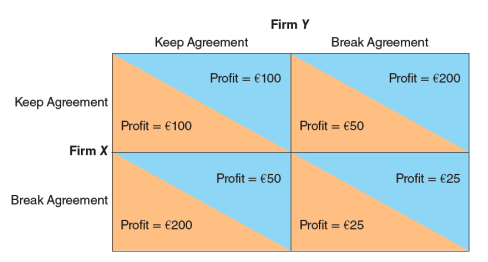
In game theory, we can also define the followings:
- a dominant strategy is the best strategy for a player regardless of the strategies chosen by others
- a dominated strategy is the strategy that yields to a worse outcome than another one, regardless of the strategies chosen by others
International Trade
When countries own different resources/goods and have different skills/utilieis , trade can be possible and beneficiary to all partecipants.
The theory of comprative advantage states that countries should specialize in producing goods with the lower opportunity cost, produce a surplus of those goods nd them trade with other countries.
In general, allowing some trade is bettern than not allowing any. But this doesn't mean that everything that happend in the international economy make everyone better (some agents gain, some others may loose).
Old theories (example: The Ricardian Model) models trade based on comparative advantage, starting from the assumption of costant return to scale, homogeneous goods and perfect competition.
The New Trade Theory by Paul Krugman assumes increasing return to scale, network effect, product differentiation, love of variety, transport costs, enviromental costs, imperfect competition etc...
From this theories, welfare conclusions on the effects of trade policies can be different.
These new models call into doubt the extent to which actual trade can be explained by comparative advantage; they also open the possibility that government intervention in trade via import restrictions, export subsidies, and so on, may under some circumstances be in the national interest after all.
The effects of free trade are shown comparing the domestic price and the globalx price (the price that prevails in the world market):
- if a country has a comparative advantage, then and the country will be an exporter.
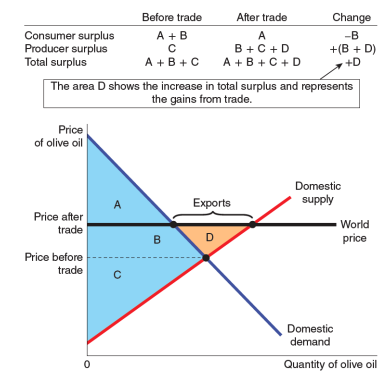
- if a country doesn't have any comparative advantage, then and the country will be an importer.
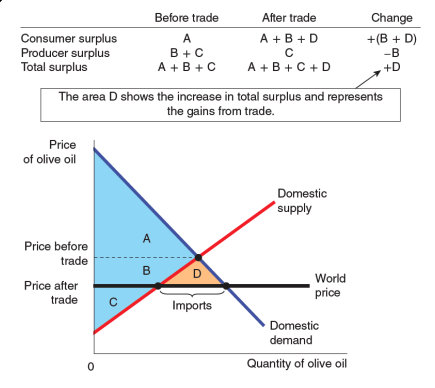
In some cases, with international trade the gains of the winners exceed the losses of the losers, so the winners can compensate the losers and still be better of. In reality, compensation is rare .
Without compensation, international trade expands the size of the economic cake, potentially leaving some participants worse off.
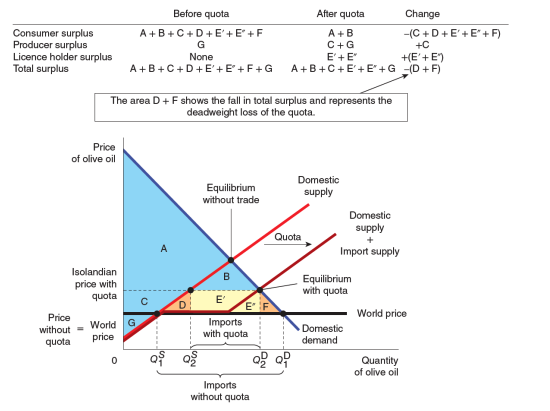
Possible trade policies are:
- tariffs: tax on goods produced abroad and sold domestically that raise the price of imported goods
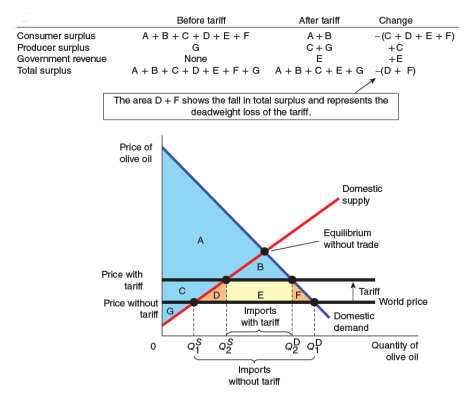
- import quota: a limit on the quantity of a good that can be produced abroad and sold domestically
Arguments for restricting trade:
- loss of jobs
- national security & increased dependence on other countries
- infant industires face difficulties to emerge
- unfair competition
- enviromental aspects
While some of there have some merit, economicsts generally believe that free trade is usually the best policy. However, free trade strategies shoyld be correctly designed and implemented to be sustainable and reduce the enviromental impact as much as possible.
Exercises
E1. Market Equilibrium
Suppose the demand curve is , where is the income measured in CHF.
The supply curve is .
Suppose , what is the market clearing price and the quantity traded?
SolutionAt equilibrium, , so we have:
If we plug in , we find:
And, substituting , we obtain the following results=
E2. Comparative Statics
In Milan, a typical student apartment rents for a month and apartments are rented. The Politecnico of Milano (the best university in the city, but this is another story), is considering expanding enrollment by lowering current academic standards.
A local economics (actually from Bocconi, the second university of Milan), estimates that, currently, price elasticity of demand for apartments is , and the long-run price elasticity of supply is .
What are the equations of demand and supply , assuming both linear?
SolutionGiven the price elasticity of demand:
if we substitute and :
Therefore we have that:
To compute :
The same applies for supply, leading to:
Part 2: suppose there is a 20% increase in the demand for apartments.
What will be the new long-run equilibrium, price and price elasticity of demand?
The new demand is: .
We calculate the new equilibriu as before:
Solving for quantity leads to:
We now calculate the new price elasticity of demand as:
E3. Economies of Scale
Giacomo Corporation has a production function described by , with capital and labout .
Determine:
- The marginal product of labour
- The marginal product of capital
- The long-run total cost curve (the minimum total input cost as a function of output). Suppose that the price of labor equals CHF 2 and the price of capital equals CHF 1.
- If Giacomo Corporation has costant return to scale (CTS), economies of diseconomies of scale.
Solution 1) and 2) Solution 2)
The obtimization problem is:
such that
Using the substitution method, we find that:
if we plug in the objective function (the total cost function):
to find the minimum value, we take the first derivative and set it to zero:
that brings to
if we substitute and , we obtain:
- To determine if Giacomo Corporation has costant return to scale (CTS), economies of diseconomies of scale, you need to calculate the price-elasticity for total cost function and see its value.
Please refer to the elasticity section in the notes for more details
E4. Price Ceiling
The supply curve for Ketchup bottles is given by , the dean by . The government put a price ceiling (luckly!) of .
How much excess demand and supply will there be at the ceiling price?
Calculate and at the ceiling price:
Excess demand occurs when and it's given by: . On the other hand, excess supply is zero.
E5. Public Good
Assume that a small town uses a referendum to determine how its residents may value a automatic ketchup distributor (public good). The voting results are aggregated by the town’s two districts, yielding the following demand functions:
- District 1:
- District 2:
where is the quantity of ketchup and the price.
If the market supply of ketchup is , calculate the equilibrium quantity and price for the town.
SolutionSince it's a public good, we sum individual's willigness to pay (prices) for each unit of the good, since all individuals consume ketchup simultaneously.
Firstly, rearrange for :
The total demand price is then given by:
We can now find the equilibrium with the market supply:
that also leads to
E6. Negative Externalities
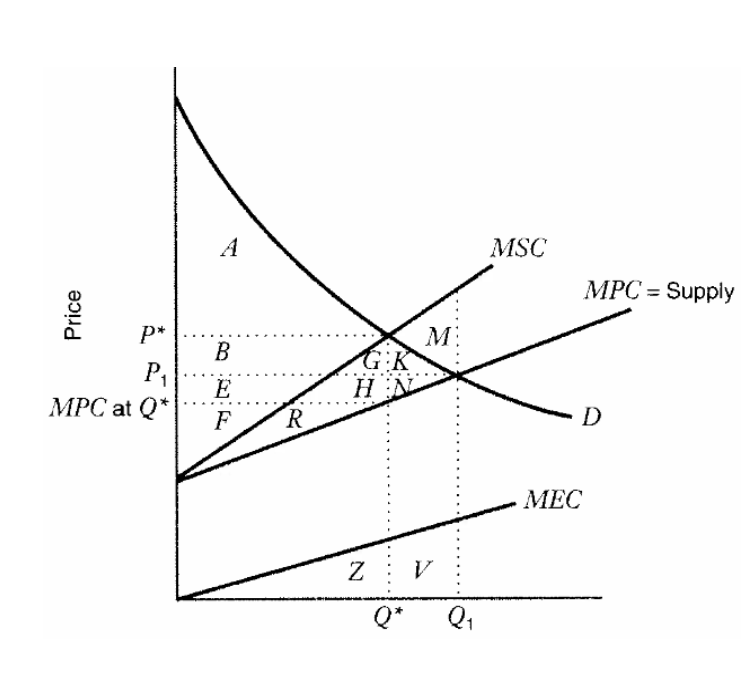
The graph below indicates the situation of a negative externality.
Assume that the government reaches the social optimum by limiting the output to . Compute consumer and produce surplus, cost of externality and net social benetits before and after the social optimal limit.
SolutionThe net social benefit, for each scenario, is given by:
The increase in benefits is calculated as:
The cost of the externality is given by the area between the (Marginal Social Cost) and the supply curve.
| Equilibrium | Social Optimum | Increase in Benefits | |
|---|---|---|---|
| Consumer Surplus | A + B + G + K | A | - B - G - K |
| Producer Surplus | E + F + R + H + N | R + H + G | B + G - N |
| Cost of externality | R + H + N + G + K + M | R + H + G | -M - N - K |
| Net Social Benefit | A + B + E + F - M | A + B + E + F | M |
E7. Tax
Suppose that the market is described by the following equations:
Suppose also that a tax of is placed on buyers. Solve for the equilibrium. What happens to the price received by sellers, the price paid by buyers and the quantity sold?
SolutionWhen a tax is place on buyers, buyers pay an higher price given by: .
At equilibrium we have:
It follows that
If we substitute back to find the equilibrium quantity :
E8. Equilibria in Competitive Markets
The industry of ketchup (considered an highly competitive market) is composed of identical firms with total cost:
for and , where is the firm's production of ketchup.
Suppose there are 100 ketchup producers. What is the short-run supply curve for the kecthup industry (expressing it as a function of the price)?
SolutionFrom the total cost function of a firm, we can find:
- the variable cost:
- the marginal cost: $MC = \partial C(q) / \partial q_i = 4q_i + 6
- the average variable cost:
In a perfectly competitive market: , provided that the price is above the minimum average variable cost.
We can indeed see that, if , , so a firm sells ketchup at as long as . (This is also called the Shutdown Price).
If we then set , we obtain:
The ketchup industry is composed by 100 identical firms. The industry supply curve is the horizontal sum of all individual supply curves:
So we can conclude that:
Part 2: What is the long-run supply curve with free entry? (Assume constant-cost industry).
SolutionThe long run supply chain curve is the one supplying ketchup at the efficient primce , where economic profits are driven down to zero.
This happens when (average total cost) is the minimum one.
To find it, we equal and :
We now substitute in the price equation to find both the price and the average total cost.
Part 3>Suppose that the demand is . What is the long-run demand quantity? Determine also how many ketchup producers there will be in the market.
SolutionIf we substitue the equilibrium price , we find:
Since each firm produces the efficient quantity , we will have producers of ketchup in the market.
E9. Monopoly
Jack LLC is a monopoly with a total cost function of and a demand curve of .
Calculate the profix maximizing and then consider a lump-sum tax of 50000?
What does Jack LCC? Does it stay in business?
What if the lump-sun tax is 100000?
Profits are given by:
we then take the first derivative:
and, from , we also find: and .
Considering a lump sum of , we can expect Jack LCC to go on with the business. If the tax is instead raised to , we can expect the firm to stop its business.
Part 2What price ceiling would maximize the total surplus?
To maximize surplus, the regulator should put the ceiling price at a point that force Jack LCC to operate like in a competitive market, so whem .
To do that, we find marginal cost as:
We then set , that leads to:
We then substitute in the price equation:
Part 3What happens if Jack LCC has to pay 40 in tax per unit sold?
SolutionThe tax changes the function: , affecting also the marginal cost, .
To find the new profit maximizing function, we calculate the marginal revenue and set it equal to the marginal cost.
Revenues are given by , so .
We then obtain:
That leads to the new price of .
The 40 tax burden is divided between the consumer and the Jack LCC.
The initial price for the consumer was 1050, so the 40 tax for the monopoly increased the consumer price by (that is the tax burden for the consumer).
On the other hand, is the tax burden for Jack LCC.
E10. Competitive Market: Cournot Model
Suppose a town with two firms, producing potable water. Suppose, in a competitive market, a demand curve given by: and .
Total revenues are given by:
Differentiating to obtain :
We then set to find the equilibrium quantity :
In a monopoly market therefore, we would obtain and, substituting in the demand and revenue function:
In a Cournout Duopoly , if we define quantities produced by firms and we set their marginal cost to zero again, we can compute again the market demand can be rewritten as follows:
The profit functions are:
Each firm maximizes profits by setting the derivative to zero.
Since the firms are identical, we set , that brings to:
- The total output is then
- The market price is
- Profits per firm are
(Confirming what we said before about quantity produced and price set in a oligopoly)
E11. Competitive Markets: Stackelberg Model
In the Stackelberg model; we keep the same starting assumptions, , with , and . We then define firm as the first mover, while firm follows.
To solve the equilibrium, we start from the end: firm observs quantity produced by and maximises his profits (same as Cournot):
Differentiating and setting to zero:
Leading to firm 's reaction function .
Unlike in the Cournot model, firm know how the follower will react, so moves in advance substituting 's reaction function in his profit function:
Now firm can maximize his profit setting the derivative to zero:
We can now find quantity produced by firm by substitugin in 's reaction function:
That leads to a market price of:
- The total output is then
- The market price is
- Profits per firm are
- Profits per firm are
We can easily notice that, being the first-mover, firm has significan higher profits than and that, since , there are still some inefficienties in the market.
E12. Competitive Markets: Bertrand Competition
In a Betrand competition model, firms compete on price. We them start from the initial starting assumptions: (that can be rewritten as ) and for both firms.
The logic behind Betrand competition is that:
- if : firm captures all the demand: and (the opposite also applies)
- if : firms equally split the market:
Therefore, the profit function is:
In this scenario, each firm has an incentive to cut prices to capture the market until ( in this case). We can then conclude:
- The market price is
- The total quantity produced is , with
- Total profits are
This leads to a situation with total market efficiency.
E13. Monopolistic Competition
Consider a monopolistically competitive market with firms. Each firm’s business opportunities are described by the following equations:
Suppose there are 4 firms in the industry in the short-run. Calculate the profit maximizing price .
SolutionWhen , the demand curve is: .
We can then calculate the marginal revenue and set it equal to the marginal cost .
This also gives: .
Part 2: Monopolistically competitive markets are characterized by free entry and exit.
As more firms come into the market, each firm’s share of overall market demand will fall - that is, the typical firm’s demand curve will shift leftward.
Entry and the resultant leftward shift in firms’ demand curves will cease when firms make zero economic profit.
Given this process, what is the profit-maximizing output and price and how many firms will exist in the industry of this exercise in the long-run?
To find the profit-maximizing output and prie, as well the final , we set two conditions:
- (as before)
- (price equals average total cost)
we know that:
we can compute as
and set equal to :
we then set :
if we substitute in the last equation , we obtain: