The following notes come from the course Production and Operations Management, held by Prof. Dr. Torbjørn Netland at ETH Zurich.
Video lectures can be found on POM's YouTube channel .
Warning: up to , the following page is 100% content-wise AI-free, so excuse me for human mistakes & typos. Enjoy!
Index
- The Value Chain Concept
- IPO and the 4Ms
- Service Operations
- Basic Concepts of Operations Strategy
- Introduction to Operations Strategy
- Production Strategy: CODP and ETO, MTO, ATO, MTS
- Capacity Management
- The EOQ Model
- Forecasting
- Bottlenecks and Takt time
- Layout
- Value Stream Mapping
- Digitalization of Manufacturing
- Industry 4.0 and Internet of Things
- FLOW and Productivity
- Just-in-Time and Kanban
- Digital Twins
- Queuing Theory
- Servitizaton of Manufacturing
- Key Performance Indicators (KPI)
- Shop Floor Management
- Jidoka and Poka Yoke
- Lean Production
- A3 reporting
- 5s
- Problem Solving Methods
- Triz
1. The Value Chain Concept
Production and Operations Management (POM) deals with processes that transform inputs into outputs and deliver products or services to the customers.
Note that POM is not relevant just in the manufacturing industry, all companies and organizations need to think about how they organize their processes.
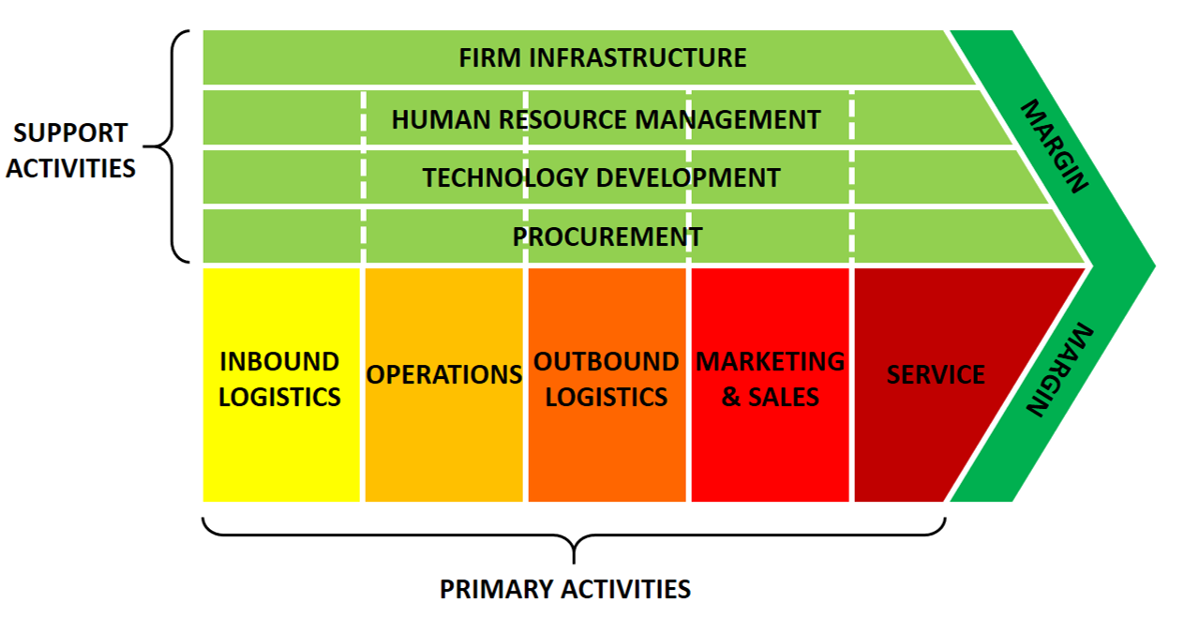
The value chain concept by Michael Porter (1985, from Competitive Advantage: Creating and Sustaining Superior Performance) describes the various functions in a company along the value chain.
It differentiates them between:
- Primary activities are inboud logisitcs, operations, outgoing logistics, marketing, sales and services.
- Support activities include procurement, technology development, HR management and firm infrastructure (accounting, legal, administrative and general management)
Trader's Joe Example [INVESTOPEDIA].
The Value Chain [WIKIPEDIA]
IPO and the 4Ms
The Input-Process-Output Model (IPO) describes a process that turns a input into an output.
It can be extended to the Supplier-Input-Process-Output-Customer Model (SIPOC) where inputs come from supplier and products go to customers.
The IPO Model is also a common pattern in system design and software engineering, used to separate the program/software from the enviroment and distinguish between requirements (inputs), computations (processes), provisions (outputs).
The 4Ms descrube the resources needed to perform the process:
- Machine
- Material
- Method
- huMan
This frameworkd can be extended to the 10 Ms, attempting to list all the resources needed to conduct a manufacturing activity.
Besides the previous Ms, this concept includes the following:
- Management
- Milieu (the place where the process takes place)
- Mother Nature (brings the inputs)
- Market
- Motion (to move resources in the process)
- Money
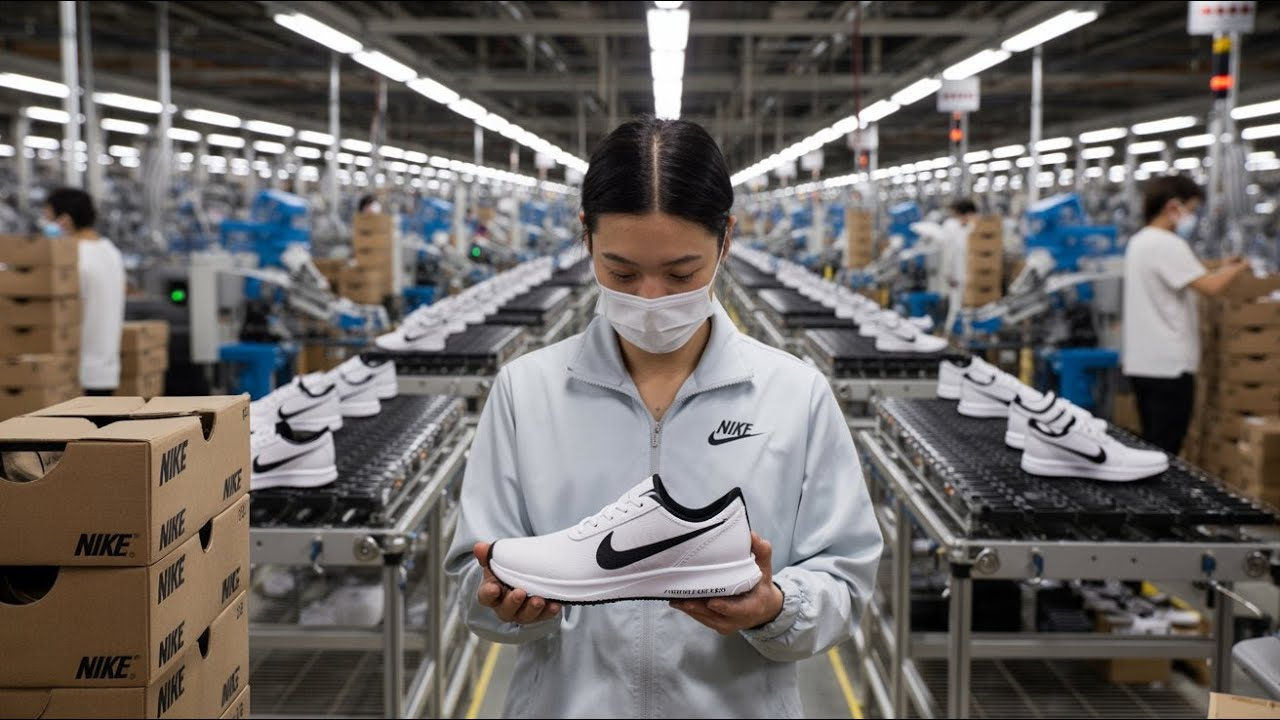
Example: Nike's Running Shoes
- Machine: Nike utilized high precision technology to maintain consistency across pairs (Flyknit Digital Looms: knitting machines that shape shoes upper in one piece, Air Manufacturing Innovation: proprietary machines for the iconic AIR units, Robots in assembly lines to assemble components)
- Materials: foams (ZoomX, ReactX foams), recycled polyesrer, carbon fibers
- Method: cold cement construction to bold the sole and the upper, rapid protopying using 3d printers.
- huMan: Nike's 1.1 million worksers, including the Nike Sport Research Lab and elite athletes.
- Management
- Milieu: large scales production plants in Vietnam and headquarters in Oregon
- Mother Nature: natural rubber for the fibers and the shoes
- Market: distinct shoes for different markets and different runners
- Motion: internal logistic with over 1000 cobots in logisitic centers; a supply chain shifting from air to sea to reduce carbon emissions
- Money
3. Service Operations
Services can be broken down into processes and analzyed in a similar method to product management. There are four key characteristics making services different than products:
- Intangibility: they cannot be touched or hold, but experienced (service companies produce outcomes, not outputs)
- Inseparability: the customer is present in the conversion process
- Heterogeneity: usually it is very difficult to make each service expertise identical
- Perishability: they are time-restricted adn cannot be stored.
In practice, there is not a sharp demarcation between products and services. Most offering are a mix of both (prodiuct-service continuum).
In general, we can identify six archetypes of services:
- Business-to-Business (B2B) - Amazon Web Services, strategic counselling, cleaning services...
- Business-to-Customer (B2C) - cideogame subscriptions, Netlix, ChatGPT personal subscription...
- Internal Services - internal HR management, accounting, finance...
- Public Services (G2C) - health, education system...
- No-Profit Services
- Consumer-to-Consumer - Facebook marketplace, Fiverr...
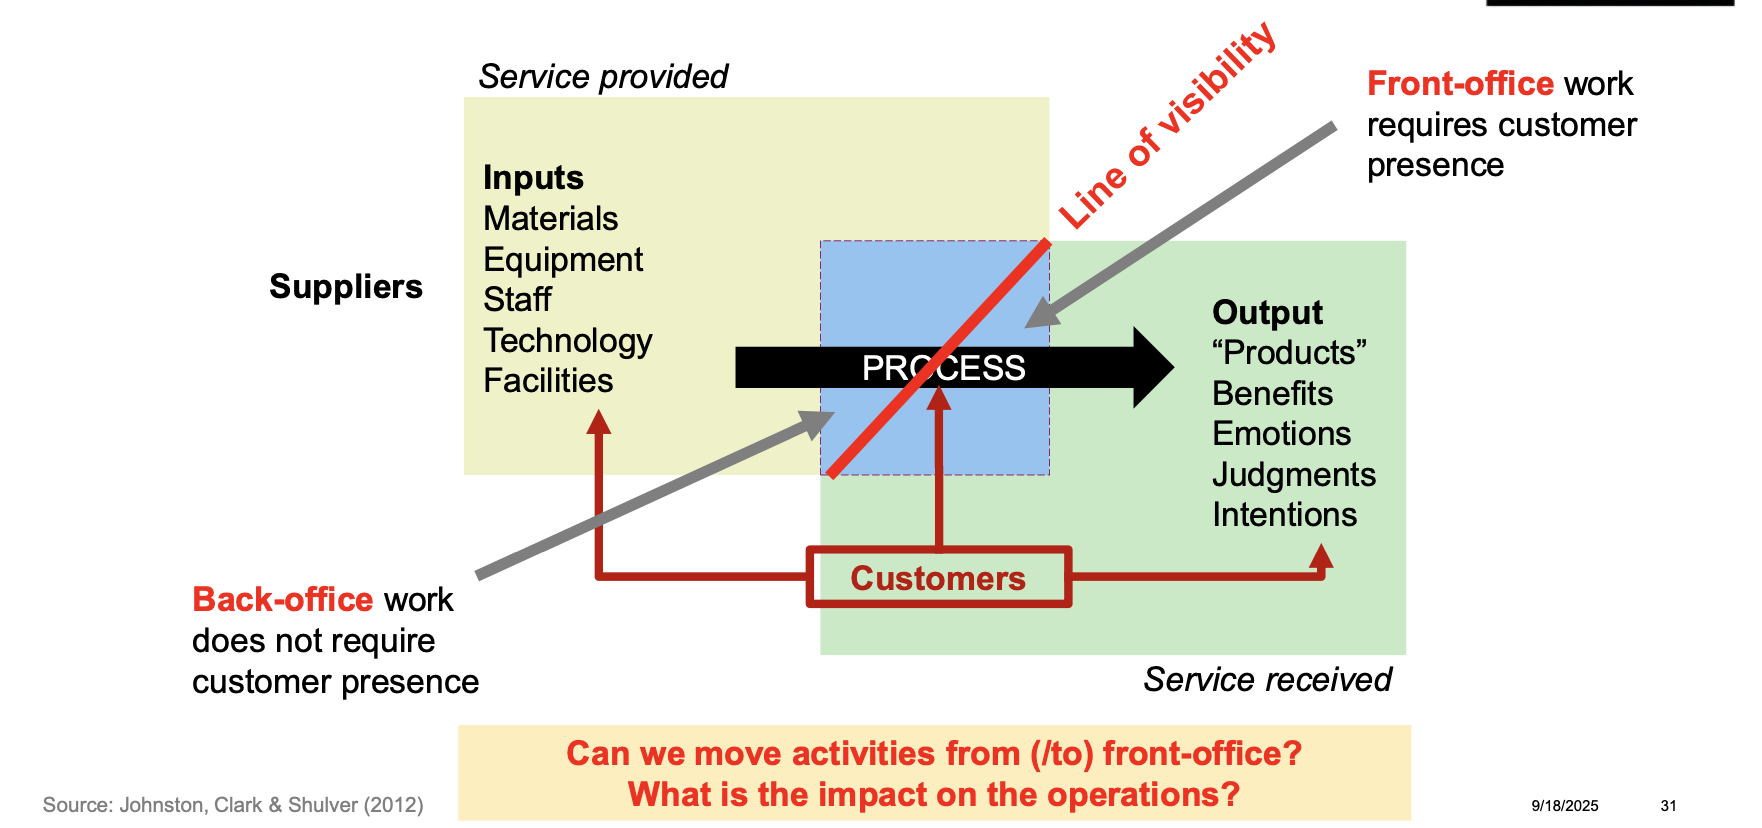
Another key distinction lies in:
- Front-office servies: work requires customer presence (essential for the customer experience), so it has to be planned and maintained (hospitality, customer support...)
- Back-office services: work does not require the customer presence, processes are often more standardized and streamline (IT support, supply chain management...)
4. Basic Concepts of Operations Strategy
There are two dimesions for evaluating operations strategy:
- Effectiveness: the degree to which something is successful in producing the desidred result (defined by the customers/market!)
- Efficiency: the state or quality of being efficiency, that is achieving the maximum productivity with minimum waste or expenses.
Often, effectiveness is measured outside, efficienty inside the company. Note that these two attribtues are totally independent: a company can be very effective while still being efficient
Example: Twitter around 2010-2020 was one of the most used social media platform (strong effectiveness), while still being notorious for his "sclerotic culture" (slow product development, high headcount, low profitability, fragile backend etc... resulting in low efficiency)
Then we can distinguish:
- Competitive priorities: how a company wants to complete to win customer orders. They denote the differentiation strategy (examples are: cost, quality, deliery, flexibility, dependability, speed, service, safety, innovation, customization...)
- Competitive capabilities: how a company is able to compete
Excellent companies have a good fit between.
In operation systems, there are potentially many trade-off for capabilities.
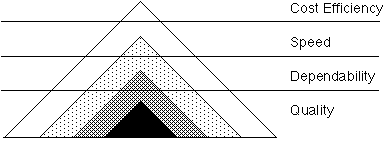
The Sandcone Model of Competitive capabilities states that, instead of looking for trade-off, a cumulative approach works better. The baseline should be composed by quality and then other capabilities can be added up to increase the competitive advantage of a firm.
Example: Amazon aligns delivery speed and selection with massive infrastructure capability, combining competitive priority (be customer-centric offering wide-variety of products and fast delivery) and competitive capabilities (wide logistic network, reliable AWS infrastructure).
Amazon's competitive advantage .
And finally, we can distinguish between:
- Order qualifier: a required capability that the customer considers when facing a choice (cost in many markets, quality in the swiss clock market, dependability in the military industry, compliace in the food industry...)
- Order winner: the quality/capability that wins the orders (quality in the houseold market, service in the insurane industry, enviromental care in the automotieve market, cost in many markets...)
Example: IKEA (manufacturing product)
- order qualifiers: a product has to look modern and functional (following the Scandinavian design principles) with short (or zero) delivery time (a customer expects to pick up the order at the store)
- order winner: the very competitive price (significantly lower than competitors)
_Example: Amazon (_online service)_a
- order qualifiers: wide variety of products, secure and fast checkout (available in other online markeplaces)
- order winner: Amazon Prime, fast and very cheap (or free) deliveries.
Note that, the distinction between order qualifier and winner can shift over time: what is a order winner (free wifi in the hotels some years ago), can then easily become a order qualifier as competitors cath up (wifi is now guaranteed in every room).
5. Introduction to Operations Strategy
The usual misconception is that operations have nothing to deal with strategy and they are just the acting part of an organization: in reality operations can be very strategic.
Example: IKEA offers 25 000 different products in 400 stores in 50 countries, becoming the world largest manufacturer. The success is large due to its supply chain and operations strategy.
- they first set the prices with the customer in mind
- then they design a product easy to produce, ship and assemble
_IKEA is also very strategic with BUY-or-MAKE decisions: 35% of IKEA's sales are wooded furnitures and 1/3 of them are producted in-house (in the IKEA Industry, the largest furnitures manufacturer). Also, the idea of the customer assemblying the parts together, reduces costs and simplify logistics.
(HelloFresh made a similar choice in the last years deliverying raw materials to customers and collecting big data from them, allowing accuracte forecasting)
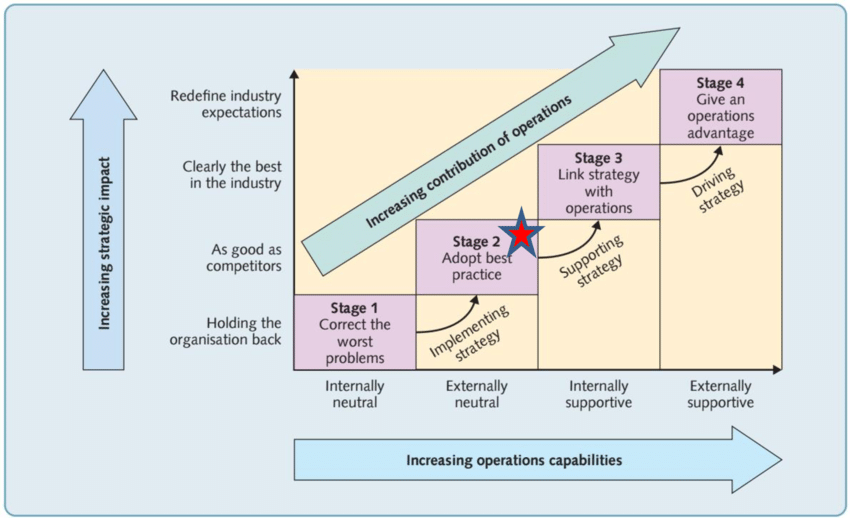
However, not all companies reach operational excellence like IKEA, HelloFresh, Zara or whatever, many companies compete despite their operational capabilities.
The Hayes and Wheelwright's Model (1979) a four-stage framework separates 4 stages of how operations contribute to corporate strategy.
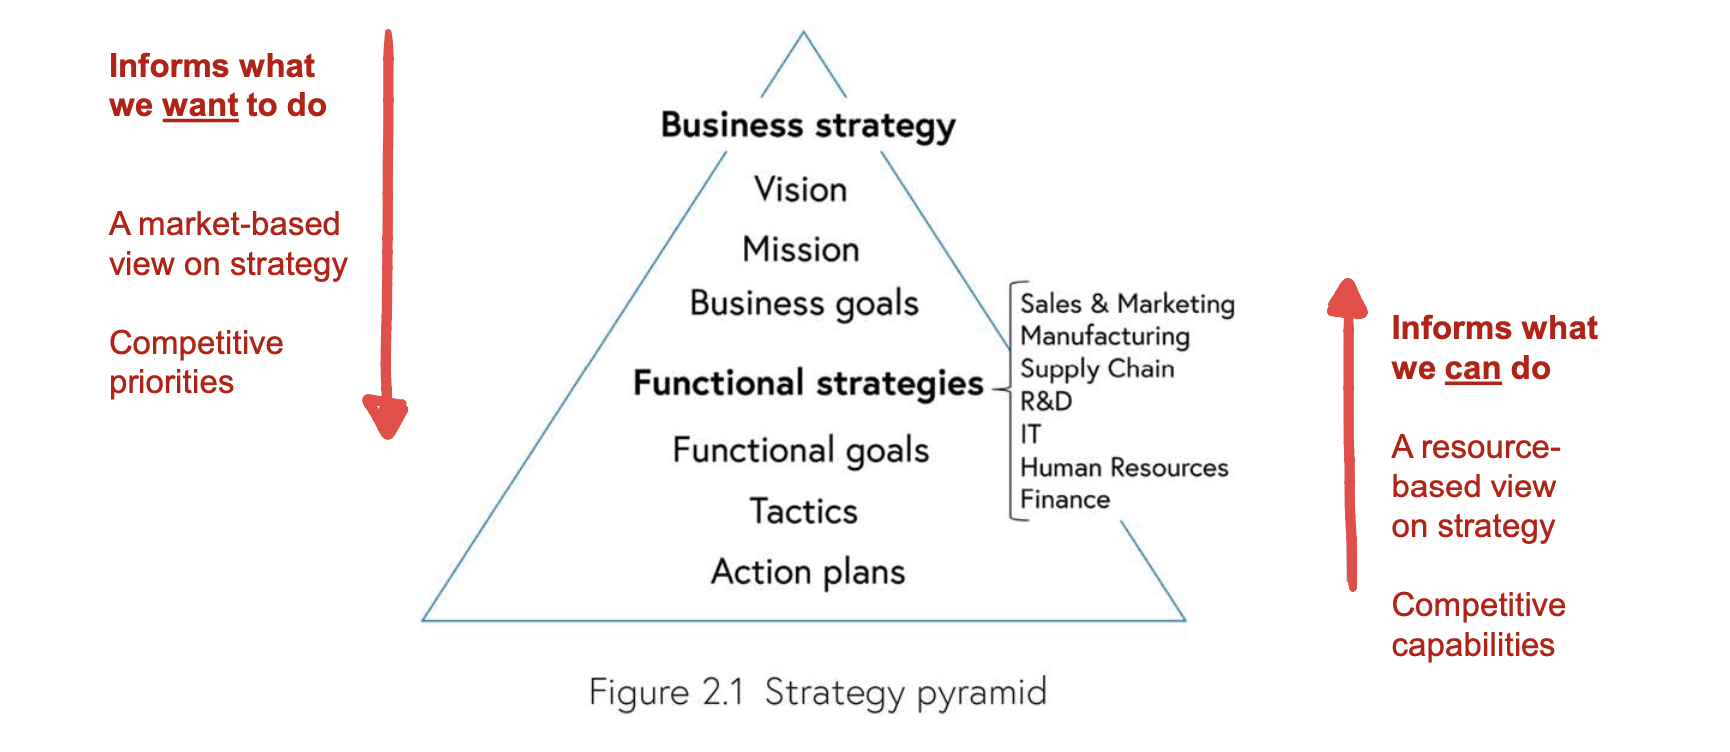
According to Wicham Skinner, every company should consciously and carefully design an operational strategy.
One way to do that is separating:
- Structural decision areas (facilities, capaicity, process technology, supply netform, information technology)
- Infrastructure decision areas (planning and control, quality, work organization, HR, product development and performance measurement)
and following three steps:
- Define competitive priorities depending on market opportunities
- Design decisions areas
- Build competitive capabilities
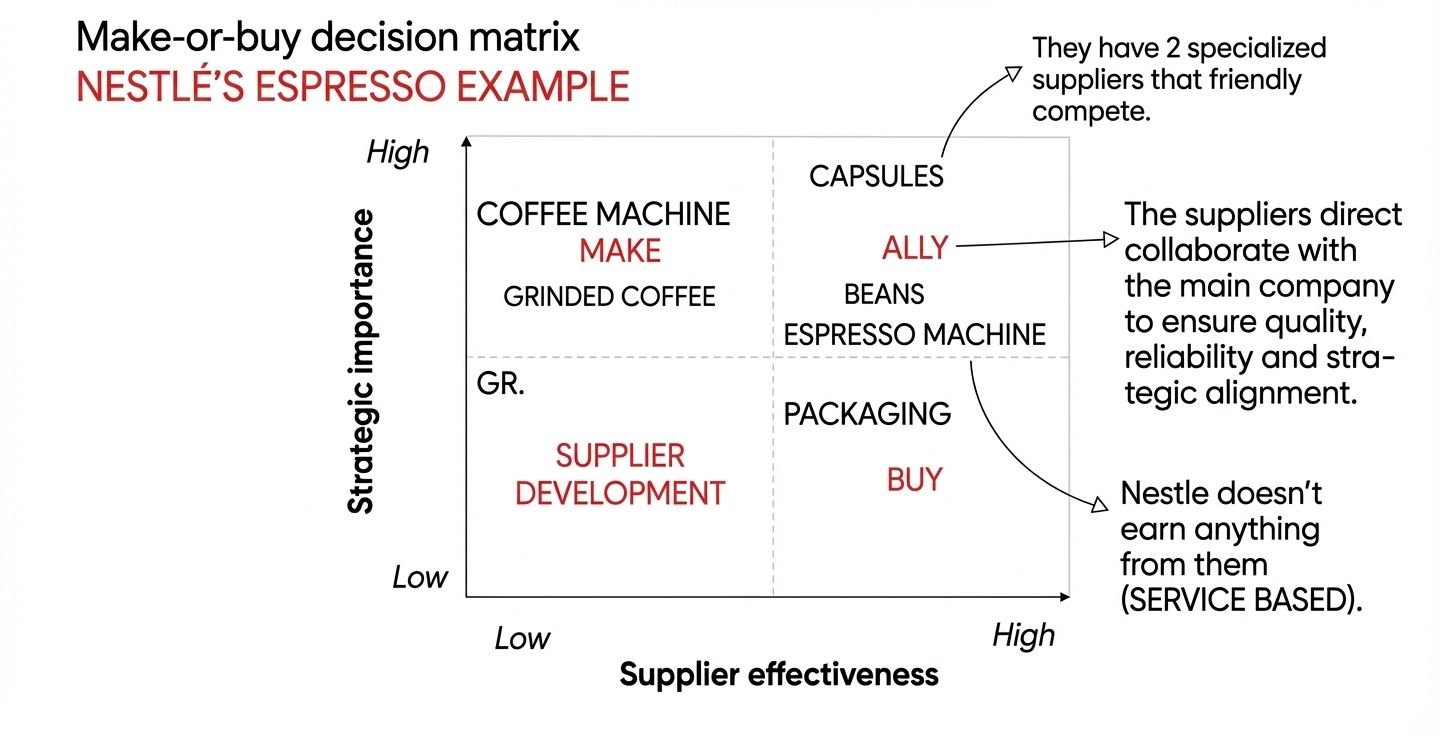
MAKE vs BUY
Drivers for more "MAKE":
- competitive advantage and innovation capability
- outsourcing risk
- quality issues
- retaining knowledge and keeping secrets
Drivers for more "BUY":
- divisoin of labor and economies of scale
- comparative advantage (the advantage of others in producing a particular good)
- core competencies
- transaction cost economics (buy when the market friction is low there's high market efficiency)
Note that modern technologies have drastically reduced transactional costs, allowing companies to "buy" services they were previously used to "make"..
In relation to that, vertical integration is defined as the degree to which a company controls/makes every parts of the product.
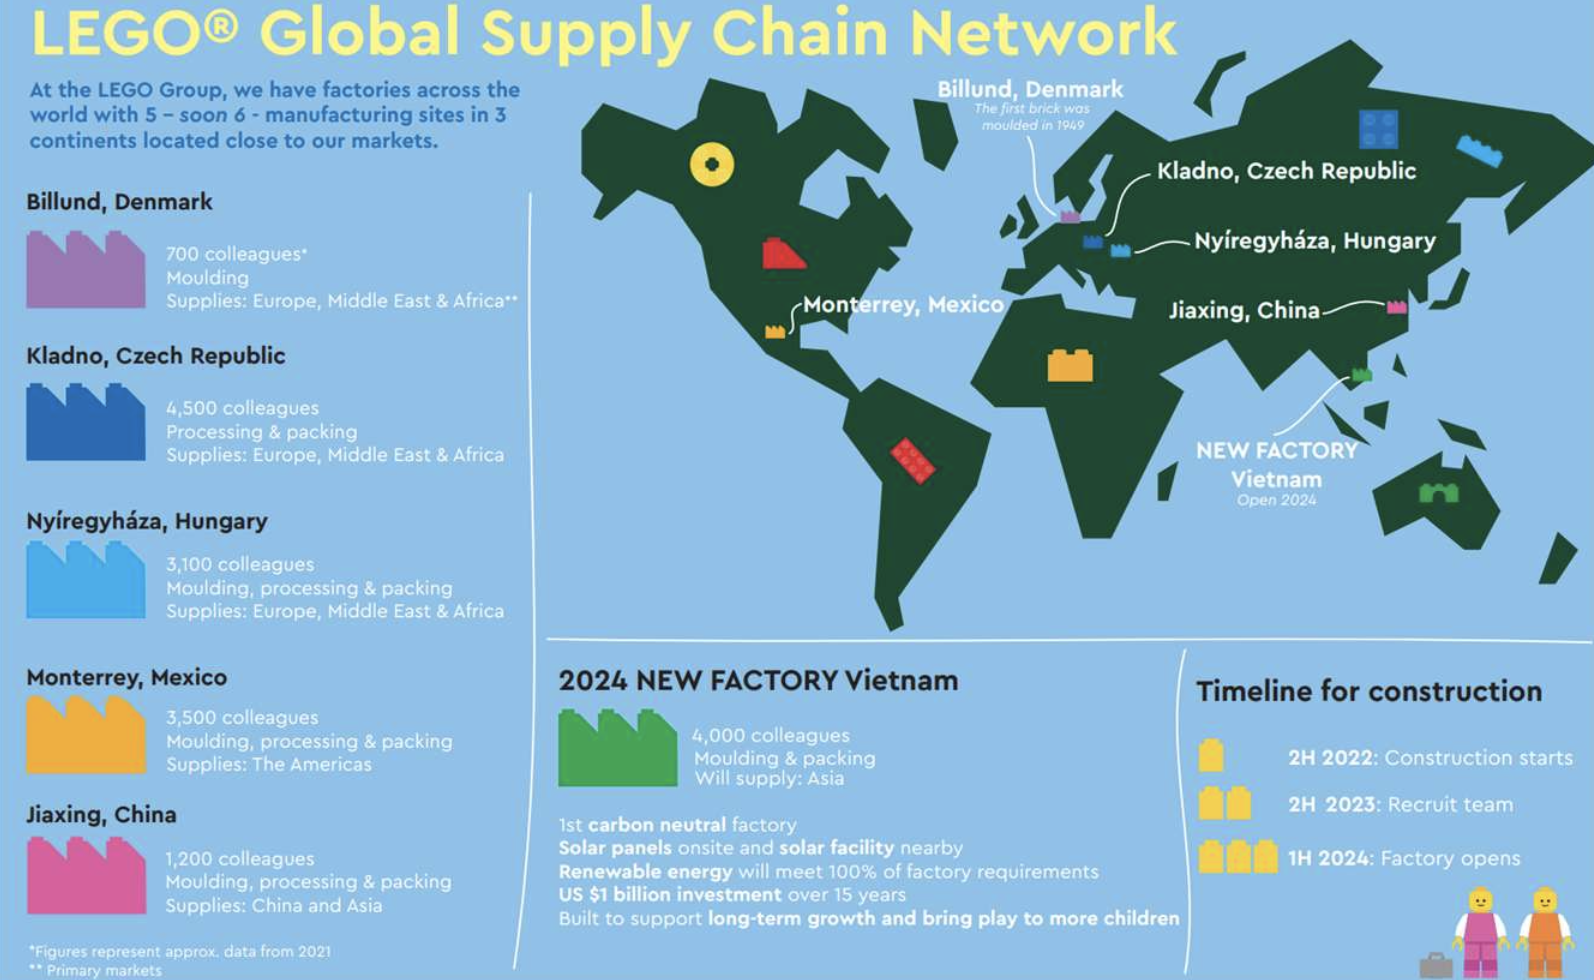
More about vertical integration [EDC Business School]Example: Should LEGO make or Buy?
- LEGO City Sets
- LEGO Architetcture sets
- Injection machines (high precision needed, designed and maintained in-house to prevent IP theft and ensure extreme precision)
- Injection mold tools
- Plastic rawmaterials
- Internal crates for WIP lego bricks
- LEGO cardboard boxes
- Design and drawing services
- Cleaning services of factories
- Operatons of LEGO flagship stores
- Operations of LEGOLAND parks
The driver for LEGO is tolerance. If a component requires high standards (near-zero defects) they MAKE. If the component is a global commodity with high efficiency, they BUY.
6. Production Strategy: CODP and ETO, MTO, ATO, MTS
The Customer Order Decoupling Point (CODP) separates order-driven activities from forecast-driven activities.
Depending on the position of the CODP, we can distinguish four production strategies:
- Engineer-to-Order (ETO): products and services are created from the board meeting customer requirements (specific software design, custom industrial machines, specialized shipbuildings, luxury houses or villas...)
- Make-to-Order (MTO): individual customers can customize the item during production (custom cars, bespoke furnitures and clothing... )
- Assembly-to-Order (ATO): the company builds components in advance of demand, then puts them together to make the final product when the customer order is received (custom bikes, custom PCs and laptops, modular furnitues or kitchens...)
- Make-to-Stock (MTS): the company makes single itmes put to inventory (fast fashion, smartphones, packed food...)
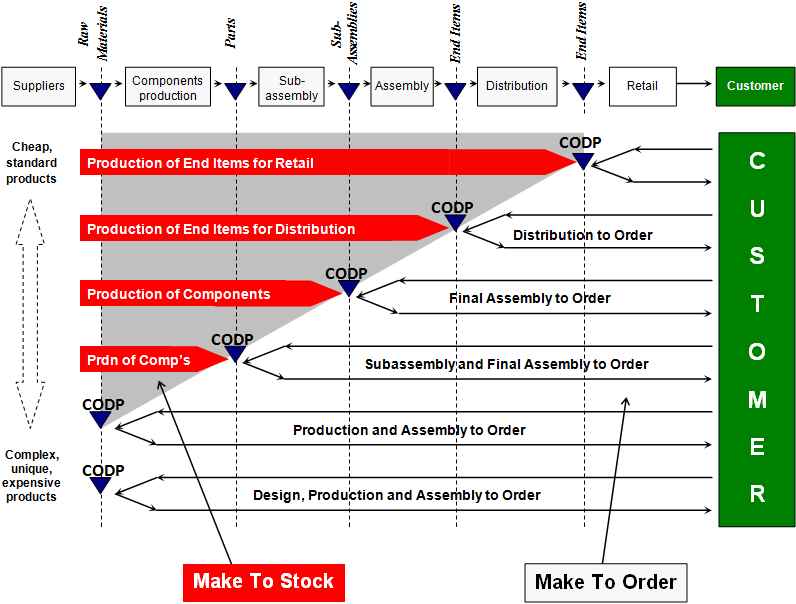
The firms has to find a trade-off between speculation (the CODP is close to the customer if processes are constrained, the firms speculated about the number of items) and postponement (the CODP is placed towards raw materials because of product-markets contraints or inventory cost consideration).
The T-point (where a product goes from one variant to many) is often a good candidate for placing the CODP.
7. Capacity Management
Capacity determines the rate at which operations trasform inputs into outputs. It can be distinguished in:
- Design capacity: expected output of an operation without any stop.
- Effective capacity: expected output of an operation less planned stops (maintenance, shift changes, special events...)
- Actual capacity: expected output of an operatio less both planned stops and unplanned stops.
Efficiency is instead defined as:
and Utilization as:
Capacities are usually adjusted in the following ways:
- introducing new machines, lines or factories
- adding shifts, increasing working hours
- sourcing capacity from suppliers or competitors
- increasing workforce
- increasing the throughput speed in processes
- reducing quality error and wastes
8. The EOQ Model
Cycle inventory: the average inventory that builds up in the supply chain because a stage produces or purchases in lots.
given the quantity/dimension of each lot and assuming that demand is stable, replenishment is costant and indipendent of demand.
Lower cycle inventory is better because:
- average flow time is lower
- working capital requirements are lower
- lower inventory holding costs
we then define:
- as the average price paid per unit purchased
- as a fixed ordering/setup cost occurring eath time an order is placed.
- as the holding cost in the inventory (including cost of capital, physical warehouse, products becoming obsolete etc...) (sometimes as a fractoin of the unit cost of product)
we then assume the followings:
- production is istantaneous
- delivery is immediate and deterministic (no uncertainty)
- demand is costant over time
- each order implies a costant setup cost
- products can be ordered and analyzed individually
Given , , , , we want to find (lot size) and (order frequency / time between orders) that minimize the total annual cost.
- annual material cost
- number of orders per year
- annual ordering cost
- annual holding cost
then the total annual cost is
to minimize TC, we take the first derivative with respect to and we set it equal to :
Rearraging we find the optimal lot size, also defined as the economic order quantity:
the order frequency is then computed as:
and the cycle time in years when demand is in years (how much time between orders) as:
To sum up, the EOQ model:
- easy to compute
- does not require data hard to obain
- policies are ronust
- assumptions can be relaxed
- it gives a good overall idea and can be the starting point for more complicated models
In general, in inventory management , there are two basic inventory reorder systems:
- Reorder Level System (EOQ models, Two-bin systems: the first bin is used until finished, triggering order, the second bin acts as backup)
- Cyclical Review System (orders are set upt intervals)
9. Forecasting
A demand pattern is usually made up by:
- trend components
- seasonal peaks components
- cyclical components
- random variations
To forecast demand, the most commono quantitative forecasting methods are:
- Naive approach
- Moving averages (or weighted moving averages)
- Exponential smoothing
- Trend projection
- Causality model/linear regression
- Hybrid forecasting with fuzzy, probabilistic and neural network methods.
Qualitative methods complement them (Delphi Method, market surveys, dcenario planning, input from sales and customer services etc...)
Six general principles for forecasting:
- Forecasts are always wrong
- Forecast are more accurate for families of products than for single products
- Forecasts are more accurate for shorter horizons
- Good forecasts include error estimation
- Forecasts are not substitue for actual demand
- Do not understimate the effect of human behavior on forecasting (BIAS)
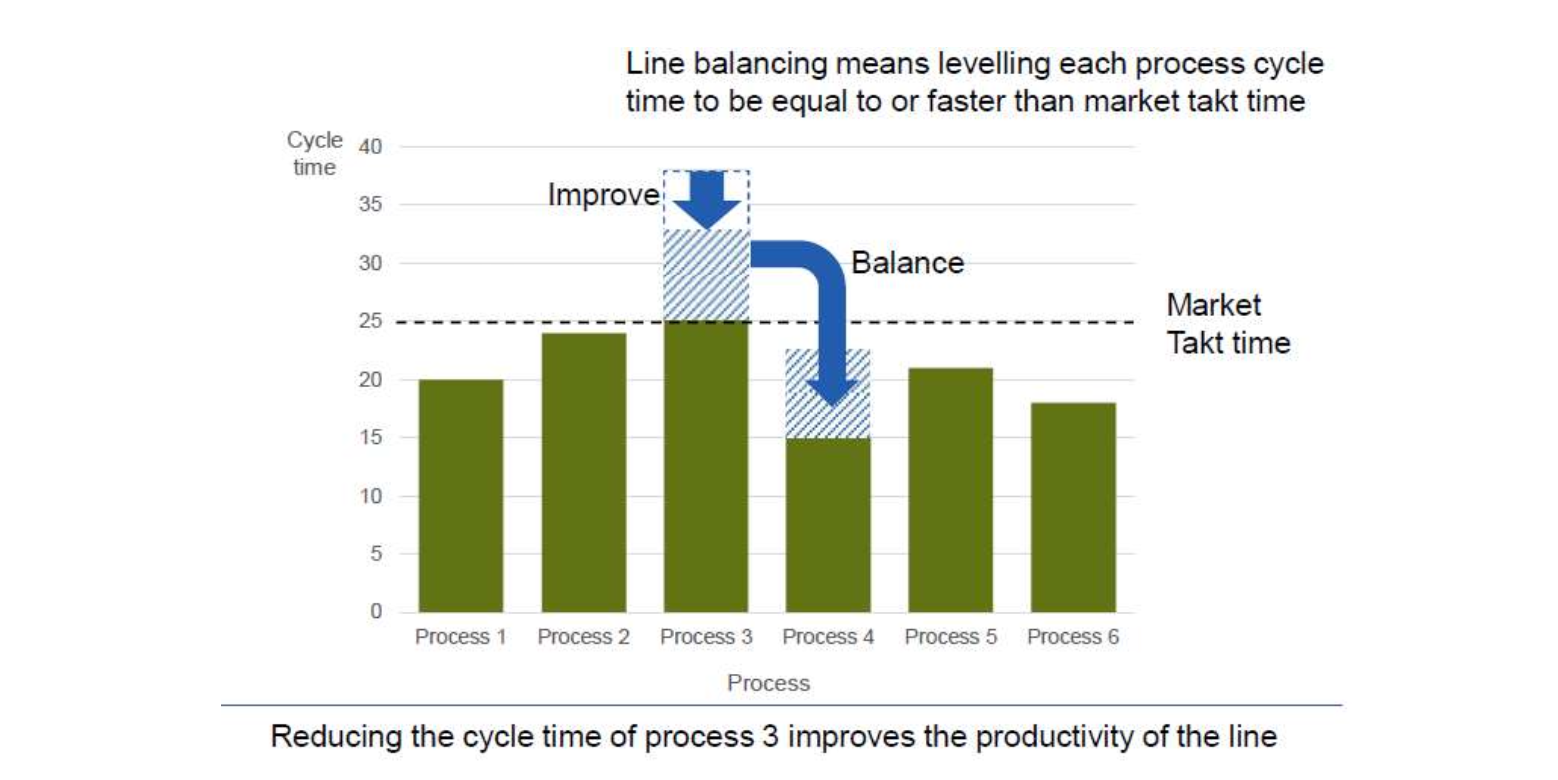
10. Bottlenecks and Takt time
A bottleneck is a capacity constraint. It is usual to define the main bottleneck as the process that constraints the throughput the most. The identification of the constraint is only transitional: when a bottleneck is removed, another appears in its place.
The takt time has two formulations:
- Original definition: average time between the production of two consecutive units.
- Lean definition: the average time between the production of two consectuvie units needed to meet market demand.
Cycle time is the time between the production of two consectuvie units in a process.
Order lead time is the time it takes from the order is placed to the product is delivered.
Throughput time is the time it takes from the start of the processing an order until it is finished.
(a common way to decrease throughput time is to reduce batch sizes toward one-piece flow).
Line balacing referers to level all cycle times of all the process. The ideal line balancing is set slightly less than the market takt time.
11. Layout
Layout refers to a floor plan. It exists in different granularities:
- a macro layout shows how buildings and departments are related each other
- a micro layout shows how production equiment, machines, storage and trasports are organized
A functional layout organized similar processes in the same area, with the following benefits:
- increased ability to handle variations in processing needs
- creation of centers of expertize
- less vulnerability to changes in product mix or machine breaks
and the following drawbacks:
- hinder and complex flow of materials and WIP products (leading to less productivity due to large buffers)
- low resource utilization rate
A product layout is a linear setup of processes steps suitable for standardized products with stable, high-volume demand and the following benefits:
- simplified training and control
- logical flows and low handling costs
- reduced buffers
and the following drawbacks:
- little flexibility in volume changes and speed
- reorganization required for a new and different product
- repetitive work
- high vulnerability to machine breakdowns
Product layout can be further divided in U-shaped and I-shaped:
| Feature | I-Shaped (Linear) | U-Shaped (Cellular) |
|---|---|---|
| Flow Direction | One-way, linear | Circular/Looping |
| Space Use | For long, big spaces | Ffor square or small spaces |
| Worker Flexibility | Low (workers stay at one station doing one task) | High (workers perform different tasks) |
| Supervision | Difficult | Easy (centralized visibility) |
| Material Entry/Exit | Far and Opposite ends of the line | Close or equa |
| Best For | Automated, heavy, or long processes | Manual, high-variety, or Lean production |
A fixed position layout is used when products are heavy, fragile, vulnerable and difficult to move.
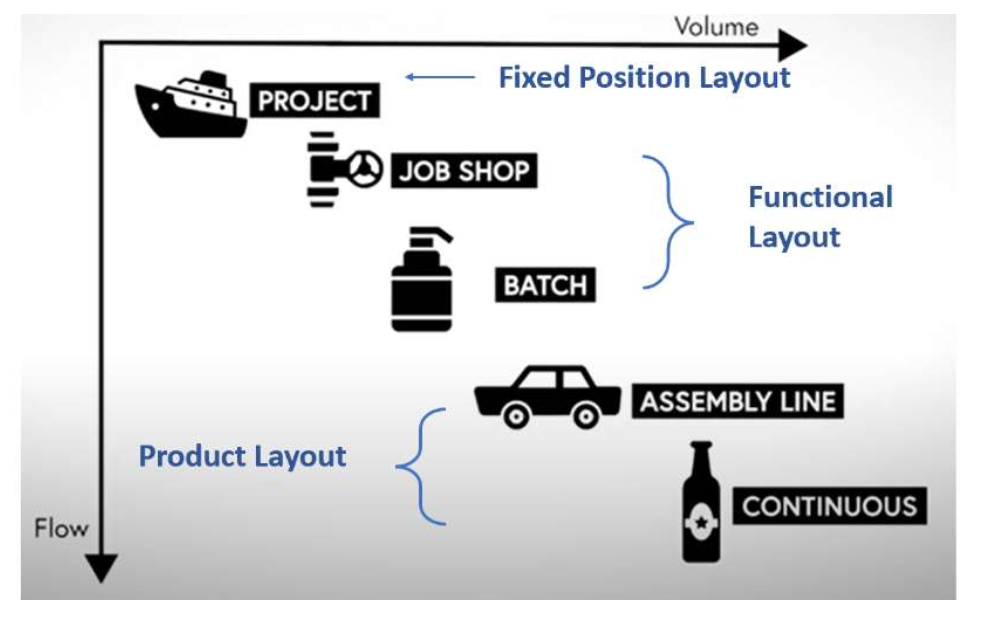
Examples from the Swiss ecosystem:
- Product Layout: coffe capsules produced by Nespresso (Nestlè)
- Functional Layout: high-precision machine tools produced by G&G Solution
- Fixed Layout: Pilatus Aircrafts
12. Value Stream Mapping
A value stream map (VSM) is a tool that creates a map of the main processes from suppliers to customers.
- it helps to analyze the current state of materials and informations
- uses inventory levels and takt time to calculate time-equivalents of inventories between processes
- helps deign a desired future state
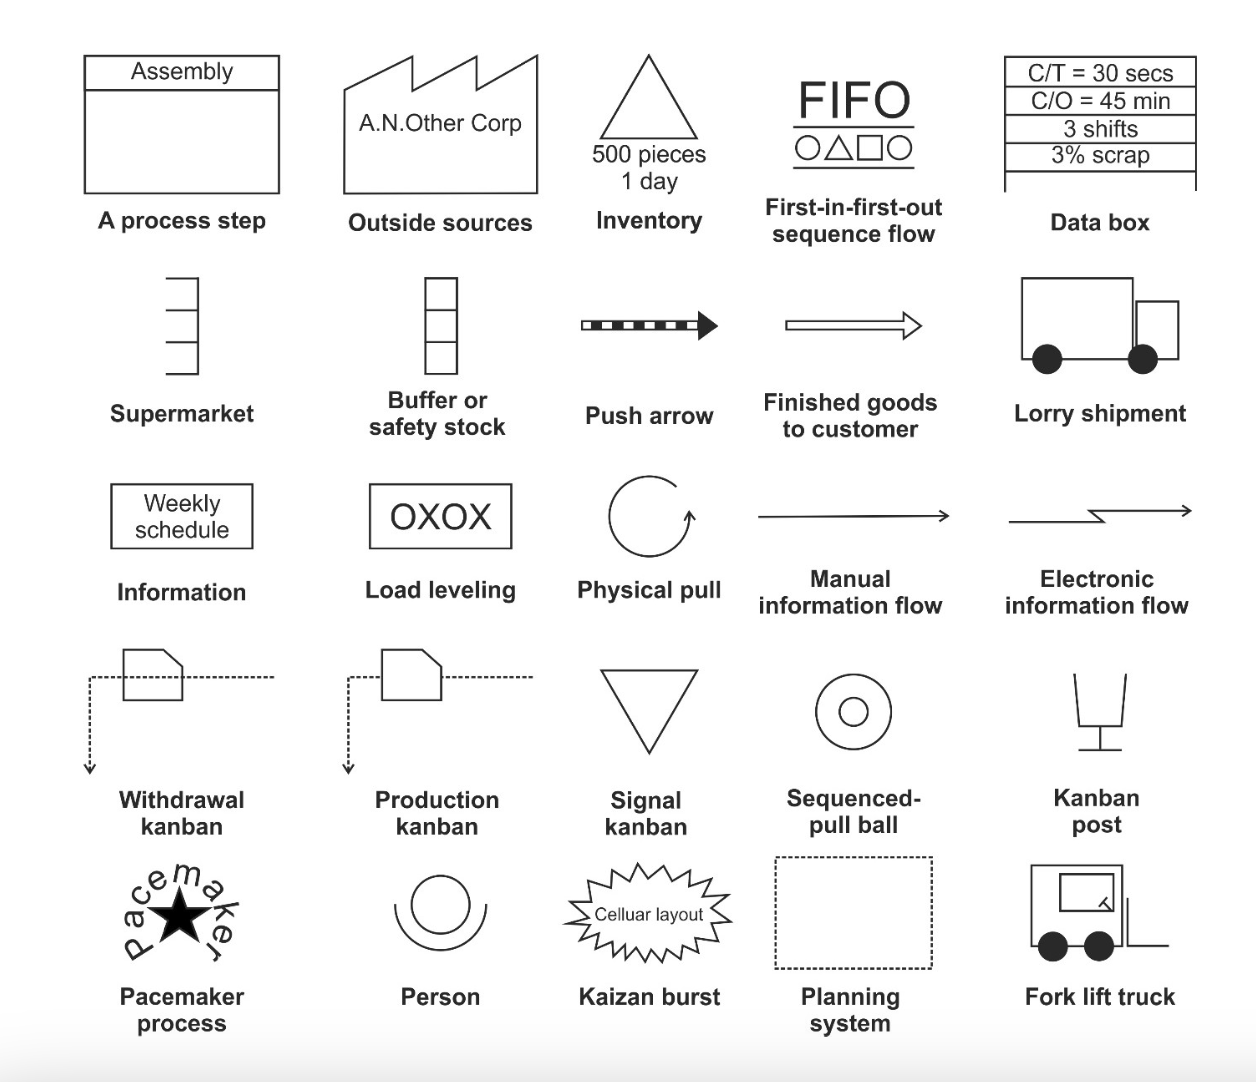
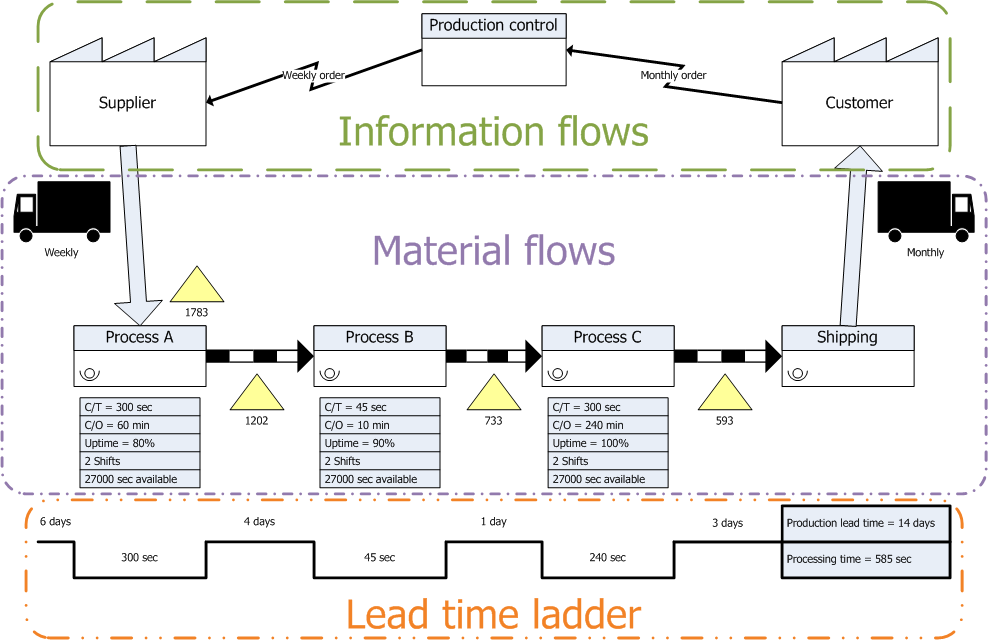
Even if the VSM is a simple tool with standard icons that can assist teams and helps find improvement opportunities, it's a static methods (takes just a snapshopt of the processes), requires costant effort to be updated and it's very limited in high-variety production settings.
13. Digitalization of Manufacturing
The IT stack in manufacturing can be described as four layers of software and hardware:
- Programmable Logic Controller (PLC): a special-purpose computer designed for industrial enviroments to control tasks on machines.
- Supervisory Control and Data Acquisition (SCADA): a software that enables remote control of PLCs and a control system for mschines, providing also a control panel for the operator to run machine remotely.
- Manufacturing Execution System (MES): production control software that monitors running operations and can be used to track deviations and targets. It connects data from the shop floors (1, 2) to the business transactional data (4).
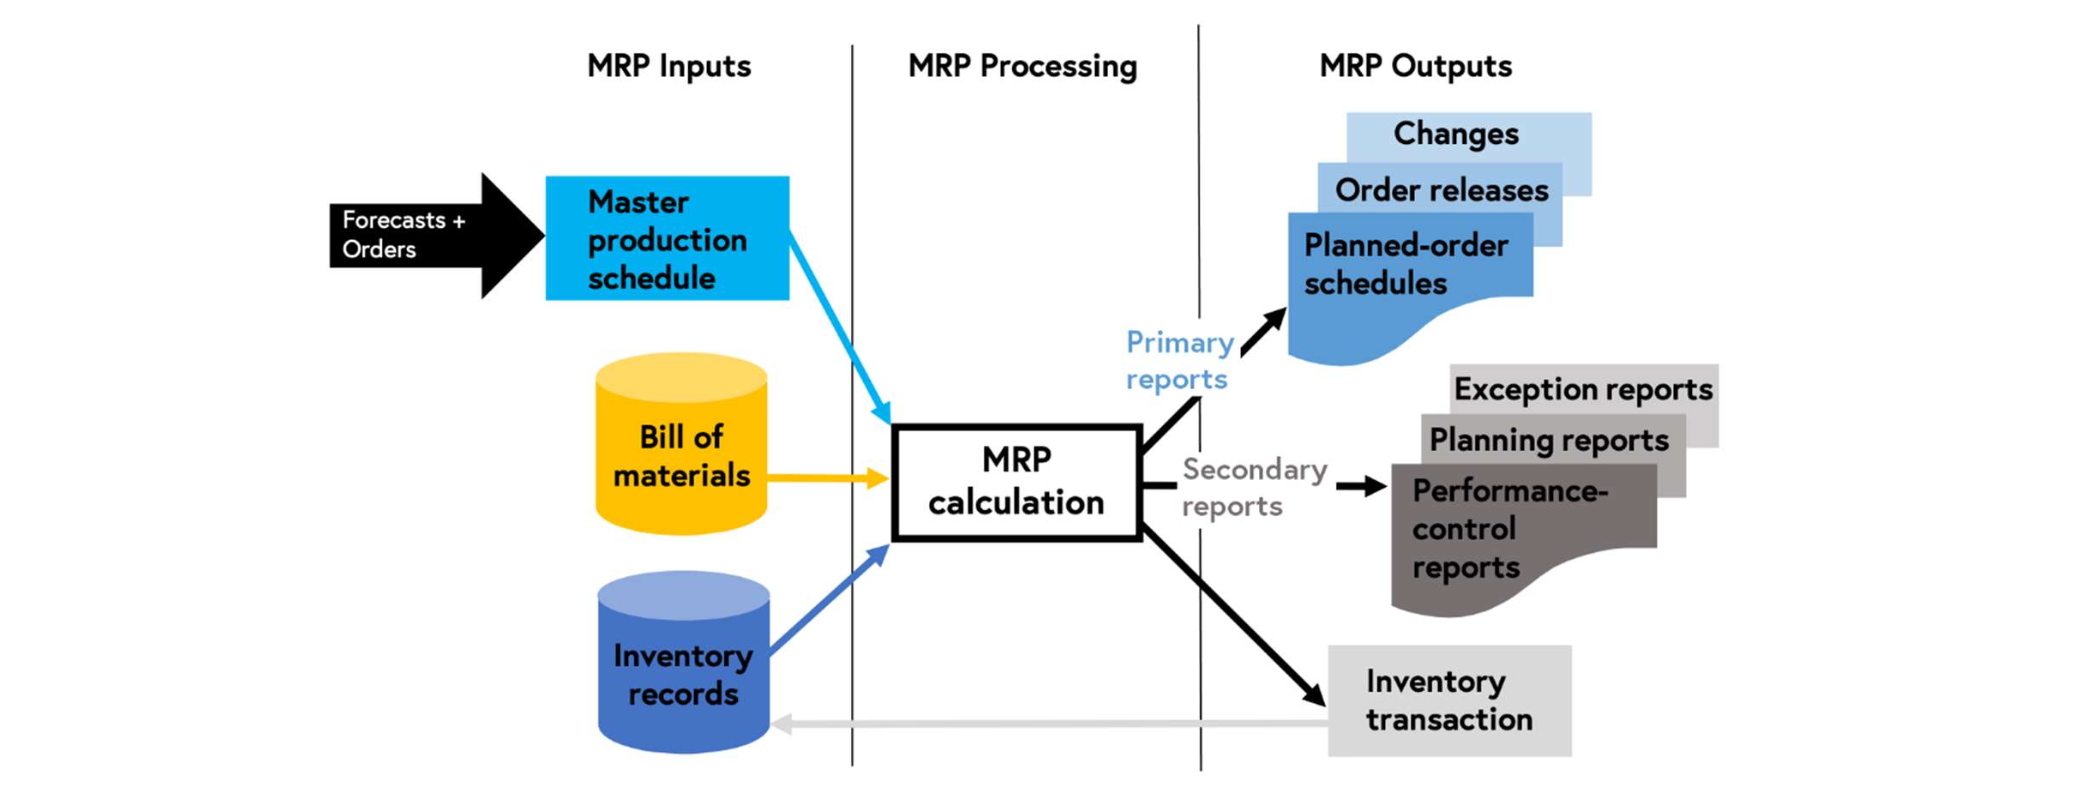
- Enterprise Resource Planning (ERP): production planning and scheduling is controlled by Material Resource Planning (MRP) modules of ERP systems.
Different layers require different software, usually with different IT standards. A middleware is often necessary to connect levels.
MRP is the planning engine in ERP systems, working out the timing and quantities to order to meet a given production schedule.
We can then distinguish 2 types of demand:
- dependent, for items that are suubassemblies or component parts to be used in production or other goods
- independent, for end-products for customers
14. Industry 4.0 and Internet of Things
According to proponents of Industry 4.0, there have been four different industrial revolutions:
- First Industrial Revolution: mechanization of manufacturing processes (1750)
- Second Industrial Revolution: electrification-enabled mechatronics (1900)
- Third Industrial Revolution: computers-enabled automation (1960)
- Fourth Industrial Revolution: digital connectivity and cyber-physical production systes (today)
According to the World Economic Forum's founder Prof. Klaus Schwab, there are three drivers of the new industrial revolution:
- velocity (technology advances exponentially)
- depth of technologies (technology spans from biotech to computers - several sectors involved, effects on society, economics and individuals are uprecedented)
- system change (in a connected world, one change is cuasing changes elsewhere due to interdependencies)
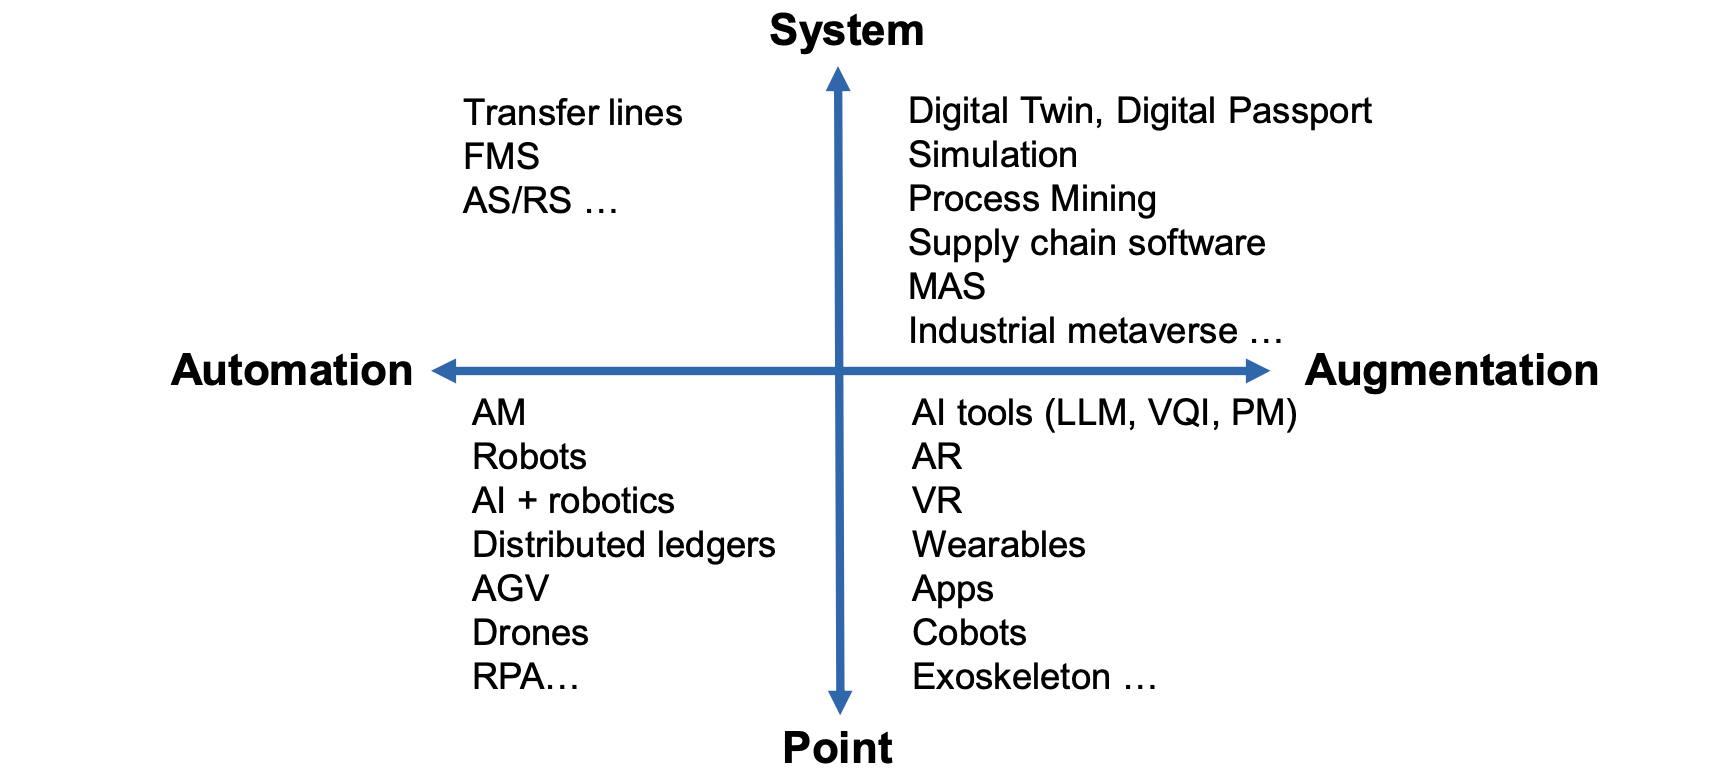
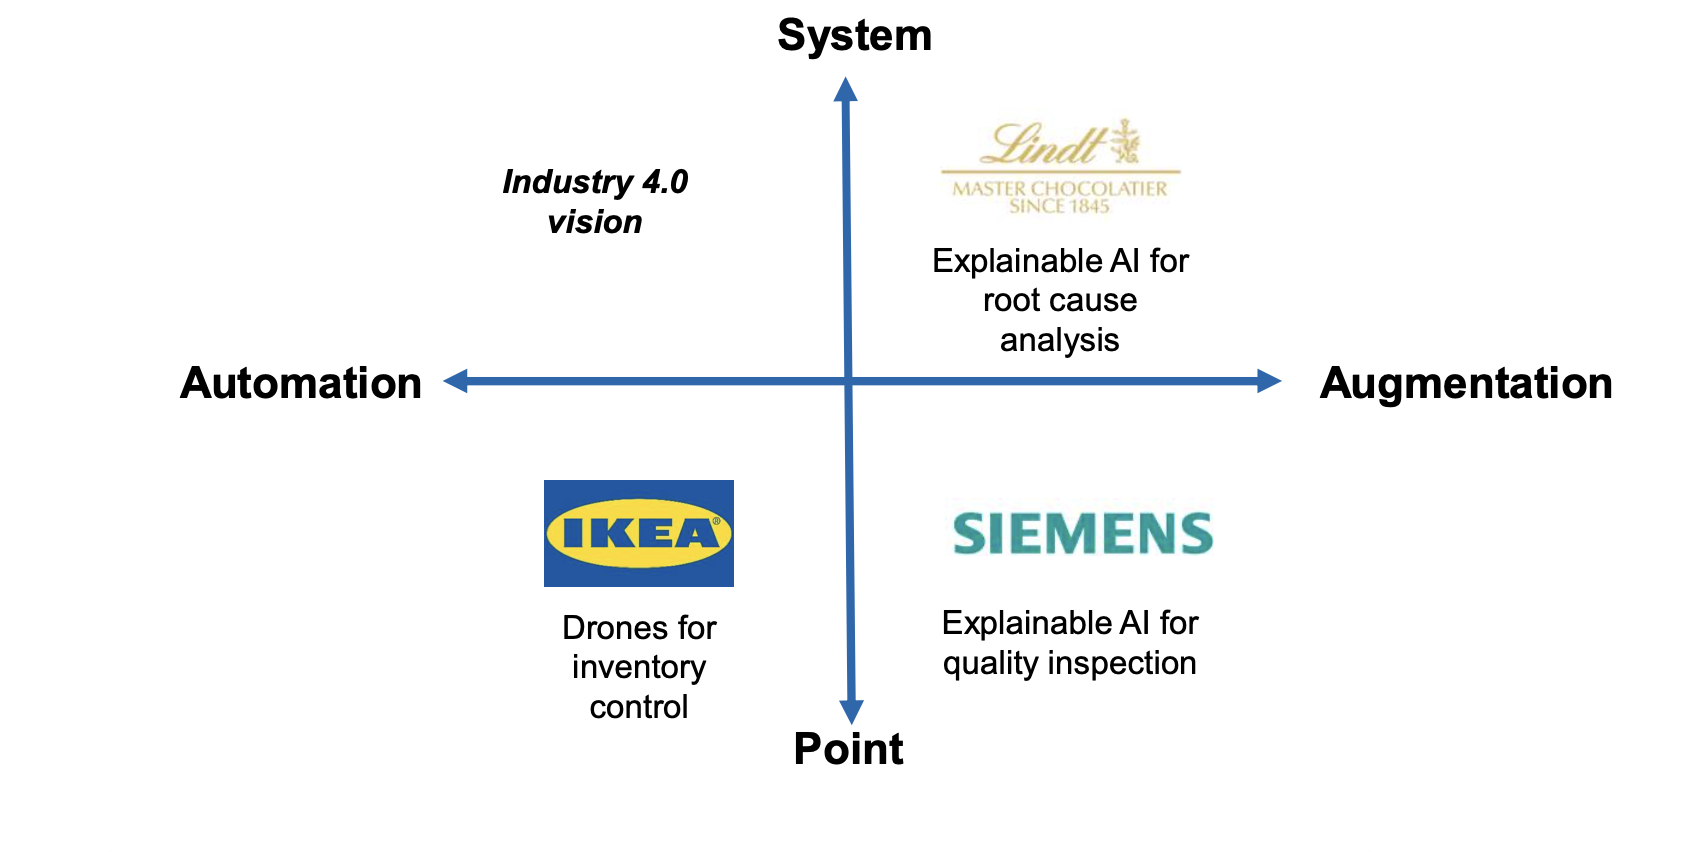
The 4th quadrant (Augmentation - Point) is usually considered the best place to start with IoT technologies due to very low entry barriers.
IKEA launches drones in warehousesIKEA is expanding his fleet
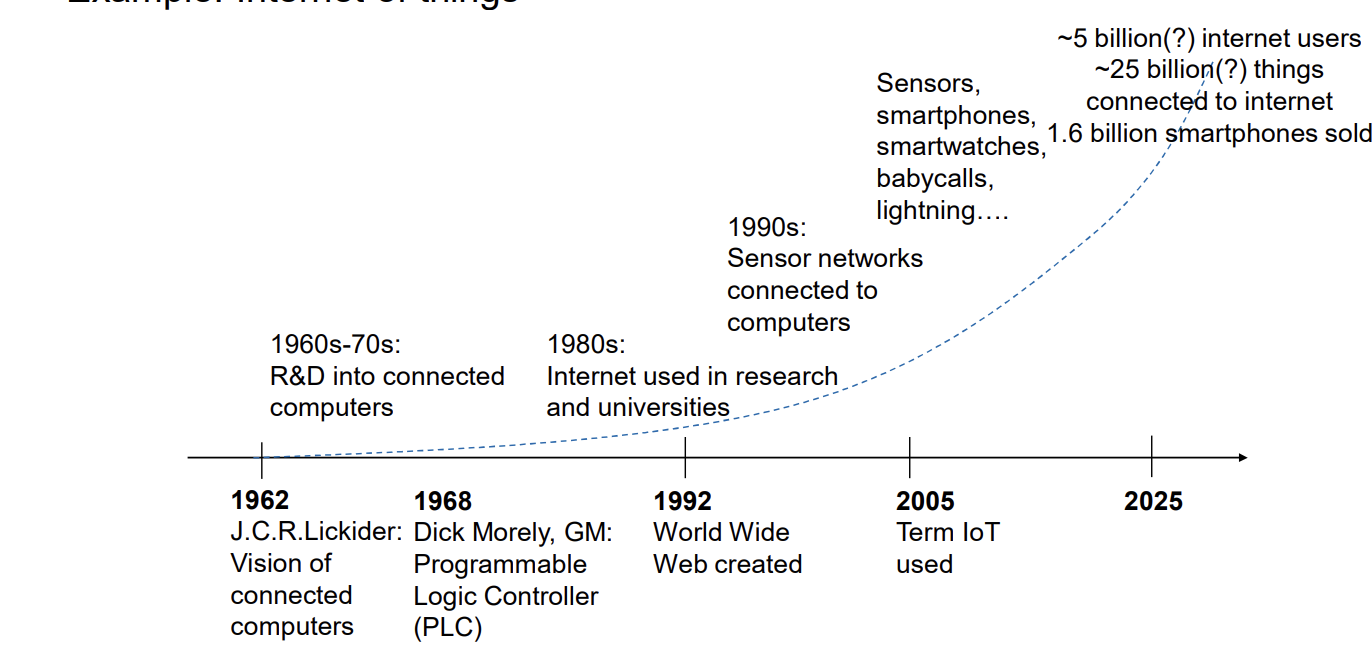
Internet of things is defined as the connection of physical objects to the internet, thanks to the use of sensors to measure and the sharing of data between each other.
IoT made good progress in the last years for the following reasons:
- low-cost and low-energy sensors
- new and wide-spread connectivity technologies
- low-cost cloud computing
- wide diffusion of data analysitics
But it's still limited (less progress than expected) for the following:
- lack of business cases
- challenges to update existing equipments
- disagreements and conflicts on standards
- concerns about security and privacy
2030 may be the beginning of a new industrial transformation lead by AI, however, the current (2025) AI adoption in manufacturing is still very low.
- 51% of companies doesn't consider AI
- 2% of companies implemented AI at scale (but we still don't know if it's a profitable investment)
Common problems in AI adoption are:
- companies are often pursuing the wrong AI applications
- large difference in AI readiness across industries
- privacy, safety and risk concerns
- companies need first to map their processes and collect data to implement AI
- AI must be supervised and aligned with the company
Example: Systeam Augmentation to improve Root Cause Analysis (Lindt & Sprungli)
Lindt, following the TPM method promoted by the Japanese Institute of Plant Maintenance, implemented AI in the root cause analysis to improve performance considerably.
15. FLOW and Productivity
An ideal state of efficienty is described by "FLOW":
- Flexible systems
- Levelled processes
- Overload avoidance
- Waste reduction
The Theory of Swift, Even Flow by Schmenner and Swink (1998) suggests that a swifter (high throughput time) and more even (low variability in quality, quantity and timing) flow of materials increases its productivity and, to achieve that, the four Ms (materials, machines, huMans, method) must be aligned.
This theory comes with five underlying laws:
- productiity falls as variability (in demand, quality or processing time) increases
- a process is only fast as its slowest step (law of bottlenecks)
- productivity increases when a company uses scientific method to remove unnecessary motions and standardized work (often associated with Taylorism and Lean)
- better quality reduces variability and prevents the "wework"
- focusing on a limited set of products or taks improves productivity
16. Just-in-Time and Kanban
Just-in-Time (JIT) is one of the two pillars of the Toyota Production System (the other pillar is Jidoka )
Key principles of JIT:
- One-piece flow: moving a product through every steps without grouping it into batches
- Takt time: the rate at which goods need to be produced (consumption-based strategy)
- Pull System: products are pulled into production as they are needed or requested (no overproduction or forecasting)
- FIFO by design
- Visibility: every task or need must be visible on board (digitally or phisically)
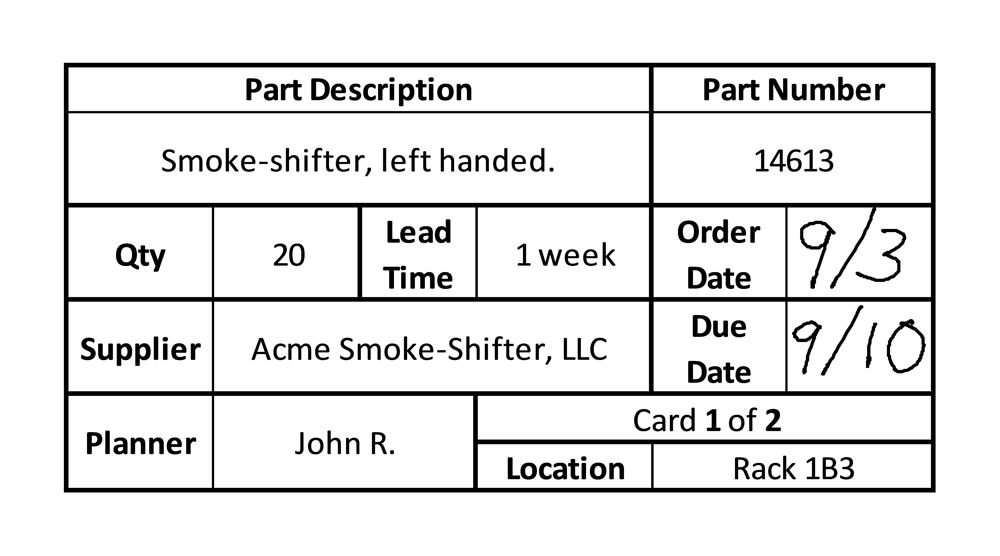
Kanban (in japanese "cardboard") is a scheduling system that aligns supplies with actual consumption:
- once a certain number of rseouces is consumed, the supplier receives a signal to produce/deliver a new shipment.
- in this way, the rate of demand controls the rate of production/supply.
- the control signal must be visualized with physical Kanban cards containing all relevant information for the supplier.
How Toyota changed the way we do things [BLOOMBERG ORIGINALS]
Toyota Production System [POM | ETH ZURICH]
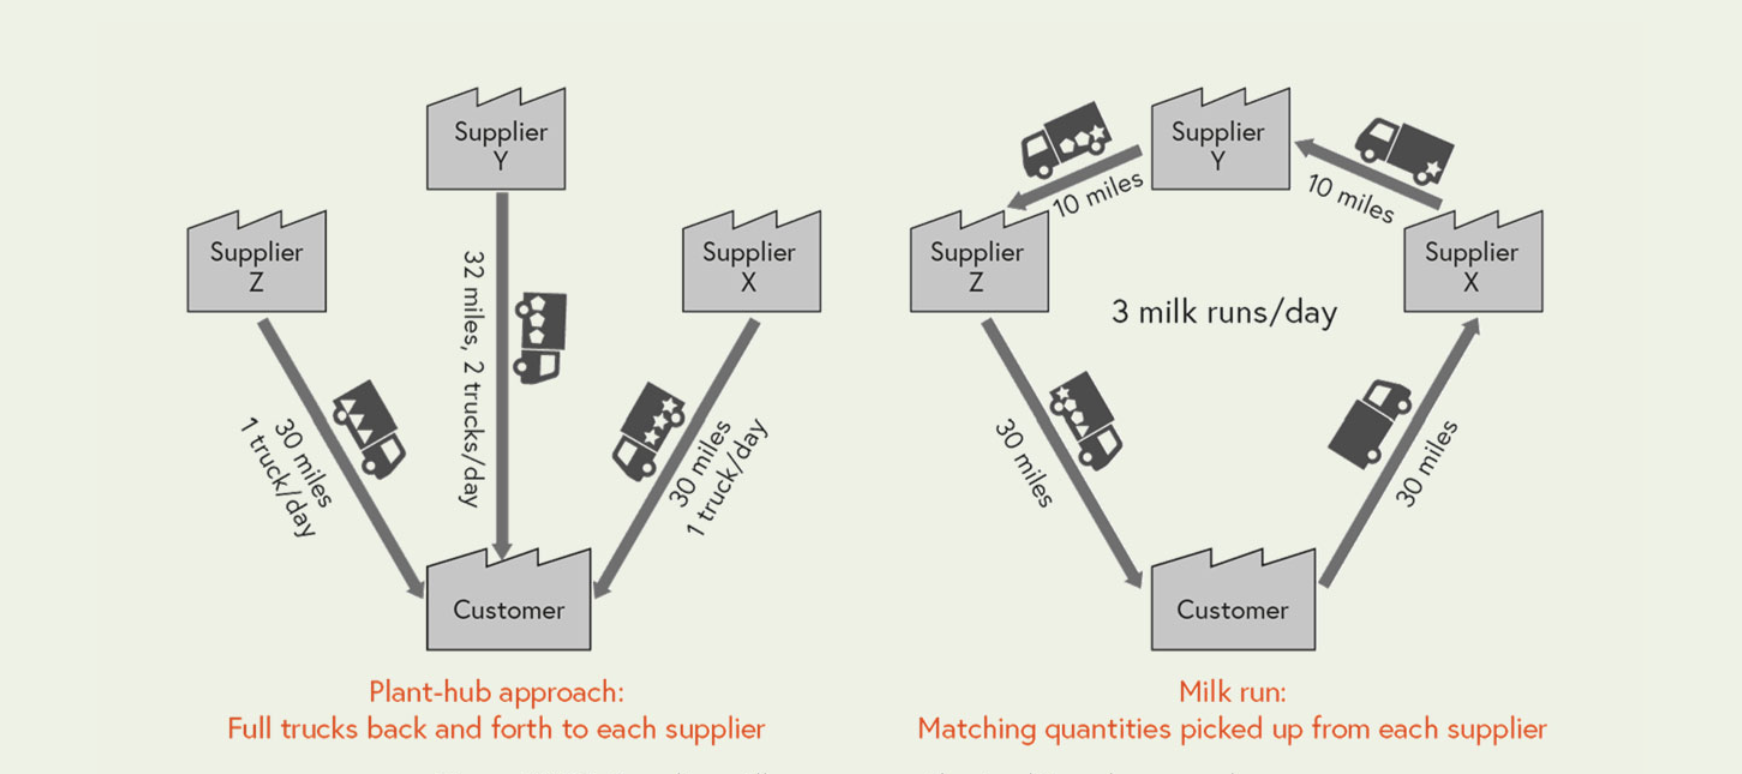
Inside a JIT system, we can differentiate between internal and external (happening outside the plant) logistic, that can be further divided in:
- Plant-hub approach: trucks (or transportations) go back and forth to each supplier
- Milkrun approach: a single truck makes the entire route reaching all suppliers (trip with many stops with geographically close suppliers)
Scenarios where milkrun approach doesn't work:
- high volume runners (if an item is needed in multiple trucks everyday, makes sense to dedicate trucks to it and have the vendor in charge of the supply/transportation)
- if an item is needed spordadically (without regularity)
- distant suppliers
Examples of milkrun approachs:
- CocaCola: trucks leave the distribution/bottling center with a mix of products, then they follow a set route stopping at multiple retailers.
- Amazon: while Amazon is famous for its "last-mile" vans, the company has planned a mid-range milk run approach: trucks stop at multiple vendor facilities ("Sort Centers") before heading to a big "Fulfillment Center".
17. Digital Twins
A Digital Twin is an integrated multiphysics, multiscale, probabilistic simulation of an as-built vehicle or system that uses the best available physical models, sensor updates, fleet history, etc., to mirror the life of its corresponding flying twin.
Depending on the degree of automation of the data flow, we can also distinguish the followings:
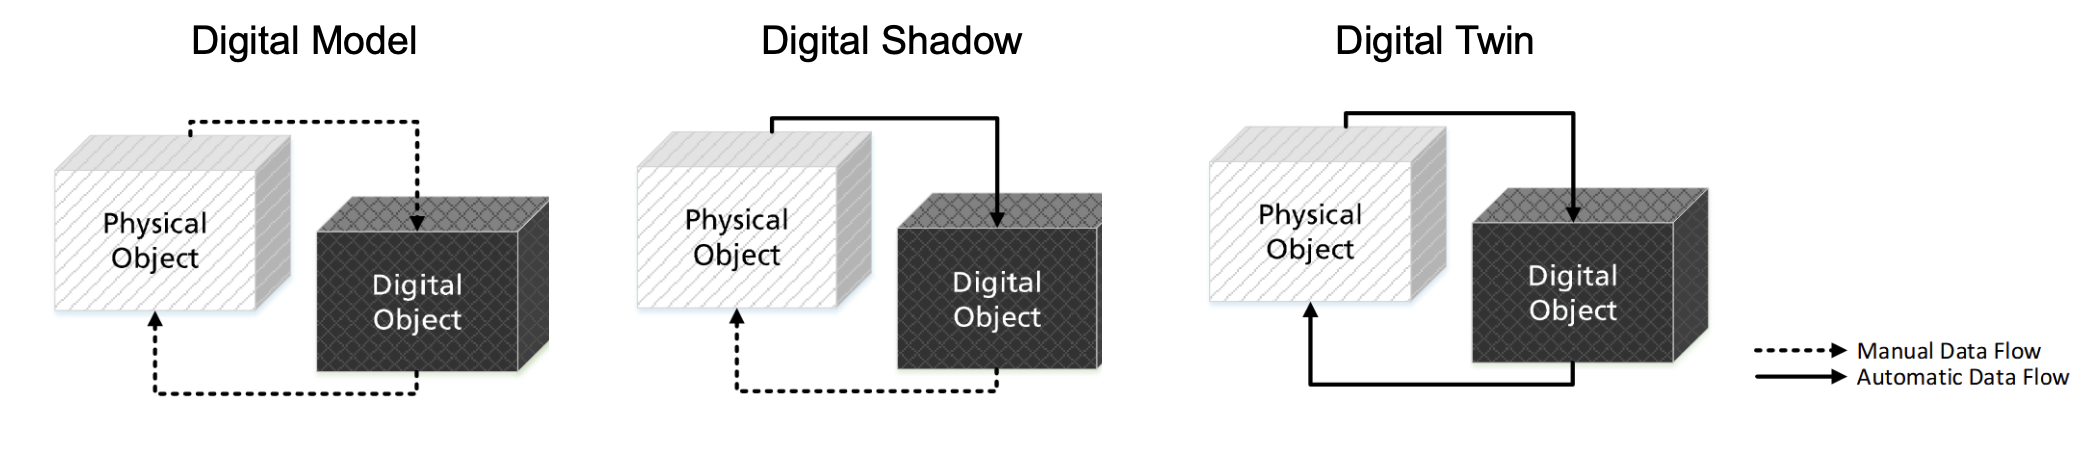
Characteristics of Digital Twin Projects:
- numerours participants, from IT to business, involved
- data sourced from different systems
- reusability in common DT projects
- model development requires often missing expertise
- periodic update required to remain up to date with the assets it represents
Challenges of DT development and implementation:
- standardize communication protocols, interfaces and data flows
- protec information against intruders
- safeguard personal data rights
- high initial investment
- internal and external objections due to regulatory requirements
- transformation to data-driven enterprise with less political and gut-feeling decisions
18. Queuing Theory
Queuing systems can be characterized by different aspects:
- number of servers/workstations
- queuing dicipling (FIFO, LIFO)
- arrival sources (infinite vs limited)
- queu space (infinite vs limited)
To study queuing systems, the Kendall's notation is common:
- : distribution of arrival times
- : distribution of process times
- : number of servers/workstations
- : maximum number of jobs in the system
and, to describe arrival times, we use the following:
- : arrival time
- : service rate
- : buffer size
- : waiting time with
- queuing lenght (Littel's Law) with
-
utilization:
-
-
: probability of state :
-
:coefficient of variation of processing time
-
: coefficient of variation of arrival time
-
: number of parallel stations
-
: mean processing time
-
: average time between arrivals
19. Servitizaton of Manufacturing
Servitizaton is the growing trend of manufacturing firms to sell services and solutions, rather than just products.
This industrial transition can be described in three phases:
- companies focus on the phisical core product
- companies provide the core product with added service
- companies sell integraded bundles of products and services (product-service-systems - PMS), delivering the required functionality in a way that reduce the impact on the enviroment.
Several benefits behind servitization and offering product-service systems:
- increased customer value
- closer interaction with the customer
- access to operational data
- more stable cash flow
- barrier to competition
- increased lock-in eggect and differentiation from other market offerings
- enviromental sustainability
And several implications:
- increased lifecycle responsibility
- challenging pricing
- the customer is integraded with operational processes
- more partnernships to provide better services
20. Key Performance Indicators (KPI)
Example of KPis for operations include, among many:
- Inventory turnover
- Productivity
- Product defects
- Customer complaints
- Overal Equipment Efficiency
- On-Time-In-Full
Note that a KPI must be SMART:
- specific
- measurable
- attainable
- relevant
- time-bound
also, we can differentiate between:
- Leading indicators are performance drivers, they measure actions and activities.
- Lagging indicators are outcome drivers, they measure results.
The classical & silly example: the number of calories you consume is a leading indicator, the weight on the scales the lagging indicator.
Performance measurement is then an integral part of managing companies.
A common approach (The Balanced Scorecard ) was developed by Robert Kaplan and David Norton after they noticed firms just focused on financial metrics.
This framework encourage a more balanced performance measurements:
- Financial perspective
- Customer perspective
- Internal business perspective
- Innovation and learning perspective
The Hosin Kanri process is an annual policy deployment process that starts with top-level strategies and breaks them down into tangible goals for different bysiness departmens. In this way, every organizational level creates its goals to meet performance challenges set by the above levels (catchball process).
21. Shop Floor Management
Lean Shop floor management describes an integrated managerial system that facilitates daily communication, control and team building on the shop floor, with the following characteristics:
- short daily meetings, with the following aspects:
- held daily in approx. 15 minutes
- place for communication and collaboration between supervisors and subordinates
- typically in front of a shop floor board
- discussion of status quo aspects (safety, quality, delivery etc...)
- management's presence on the floor
- hiercachically layered meetings, allowing to raise critical issues quickly
- daily transaprecny into operations
- use of visualization
22. Jidoka and Poka Yoke
Jidoka (common element in the Toyota Production System), is to "stop and notifcation of abnormalities" and "separation of man's and machines' work".
It can be translated from Japanese to "autonomation", which means automation with a human touch.
The four steps of Jidoka are:
- discovery of abnormalities
- stopping the process
- fixing the problem
- investingating and solving the root cause
Andon can be a tool to implement Jidoka: it is a real-time visual system that alerts workers to problems, allowing to stop the production as soon as possible.
Poka-yoke (error-proof) refers to designing a process so that it is impossible for an error to occur.
- contact method: based on physical attributes or product shape (tools/wires that, due to phisical constraints, can be plugged together in just one way)
- fixed value: methodbased on the number of moovements (if you have to assemble exactly parts: a poka-yoke mechanism will end you up with exactly parts)
- motion stop method: based on the sequence of events (the ATM system: the system releases the cash just after you take out the bank card)
by doing that, it's possible to:
- eliminate mistakes or makes it impossible in the earliest stage of a process
- ensure that people and process work right the first time
- provide a significant improvement in the quality and reliability of products/processes
Examples of Poka-yoke in the automotive industry:
- In engine assembly, Nissan workers use "smart" torque wrenches. If the worker doesn't apply the required pressure or does something wrong on a component, the assembly line cannot proceed.
- GM uses electrical connectors for different sensors in a car. This makes it physically impossible for a worker to plug the wrong wire into the wrong port.
Note that, while Jidoka operates at system level, poka-yoke does it at task level.
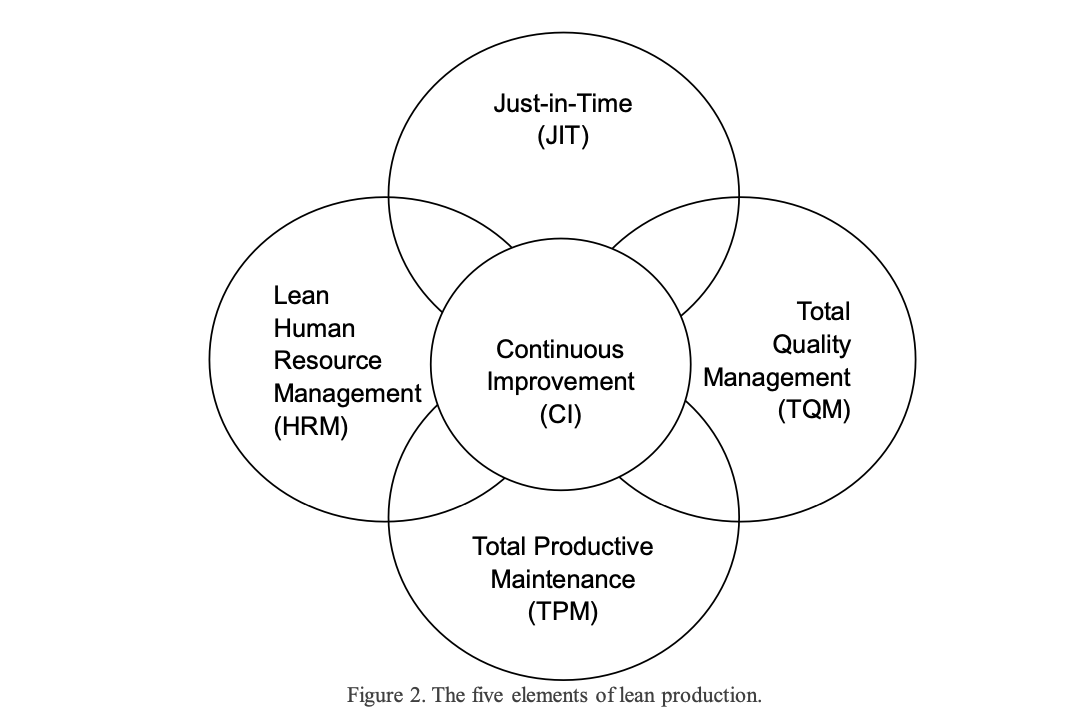
23. Lean Production
Lean is the western interpretation of the Toyota Production System from 1980-90s. The book Lean Thinking explains the five principles of Lean:
- Define customer value
-
Identify the value stream
- product-process design
- layout decisions
- master data management
- tools (value stream map, process-mining with data analytics)
-
Create flow:
- Jidoka
- Just-in-time
- Tools (Andon, Kanban, Heijunja, Poka Yoke, 5s, Visual control)
- identify and eliminate enemies of flow (muri: overburder, mura: uneveness and muda: waste)
- Implement pull production
- Seek perfection
Lean also offers a range of methods and tools to institutionalize improvements routines:
- Hoshin Kanry, an annual strategy planning and deployment process
- daily layered accountability
- Kaikaku process and daily Kaizen (= continuous improvement) activities
- improvement boards and meetings
- A3 management
According to Lean, there are 7 sources of waste (Muda):
- Overproduction: producing more than is needed.
- Waiting: waiting for materials, instructions or processes.
- Transportation: moving products, materials or people unnecessarily.
- Over-processing: using too much processing time or resources.
- Inventory: too much inventory.
- Motion: excessive motion of people or equipment.
- Defects: making mistakes during production
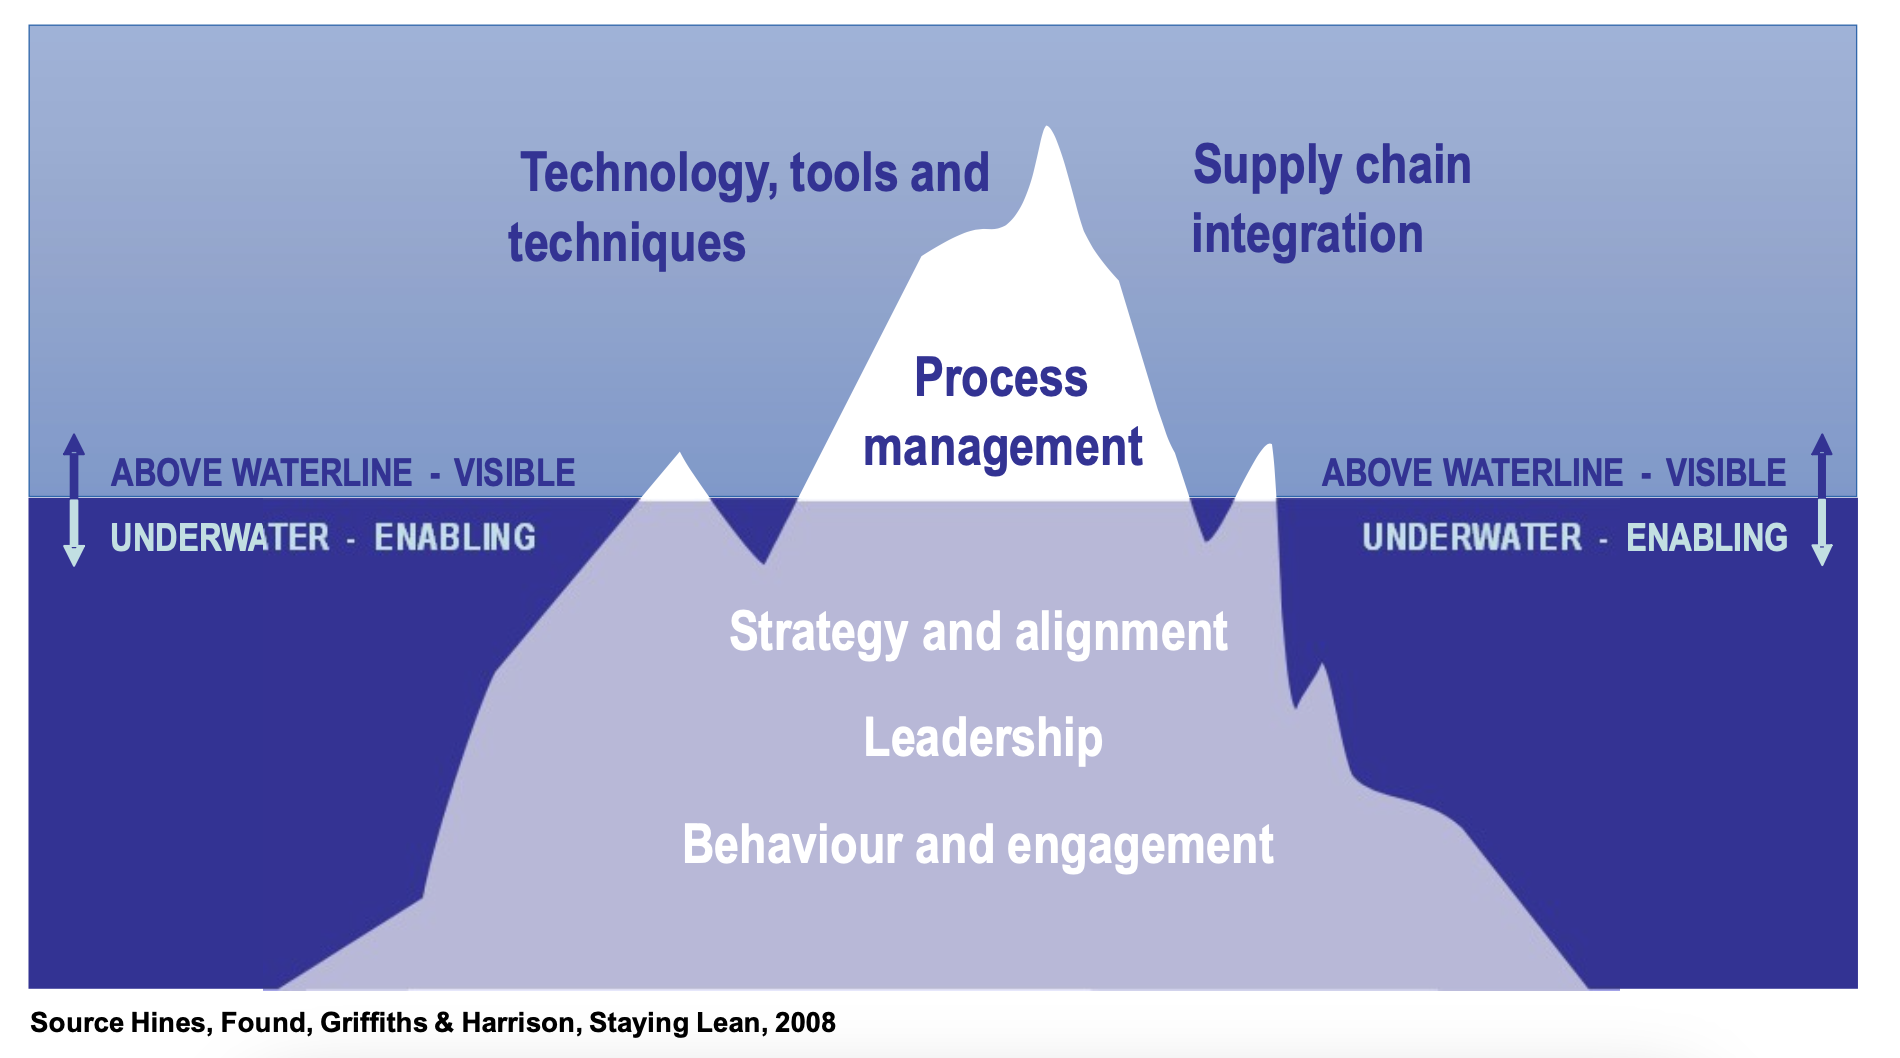
Lean is also well visualized by the Iceberg Model, that distinguis between visible and enabling actions.
The Toyota Production system was indeed based on two pillars:
- Just-in-time ensures consistent delivery of the right parts, resulting in low inventory levels
- Jidoka ensures delivery of the right part at the right time with the right amount
TPS is not soley a inventory reduction strategy, but an holistic approach that includes product design and supply chain mamangement, for example:
- integration of suppliers in the Toyota's supply chain
- collaboration with local suppliers through investing in capabilities and supplier network programmes
The secret behind TSP lies in its culture and leadership philosophy, partially described by:
- Challenge: never be satisfied with the status quo
- Kaizen: always look for a better way
- Genchi Genbutsu: "go and see" the place where works occur
- Respect: demostrate respect for what machines and humans can and cannot do
- Teamwork
A Company-specific Production System (XPS) is a productivity improvement program tailored to a firm's need, largely modelled on Lean an Toyota PS.
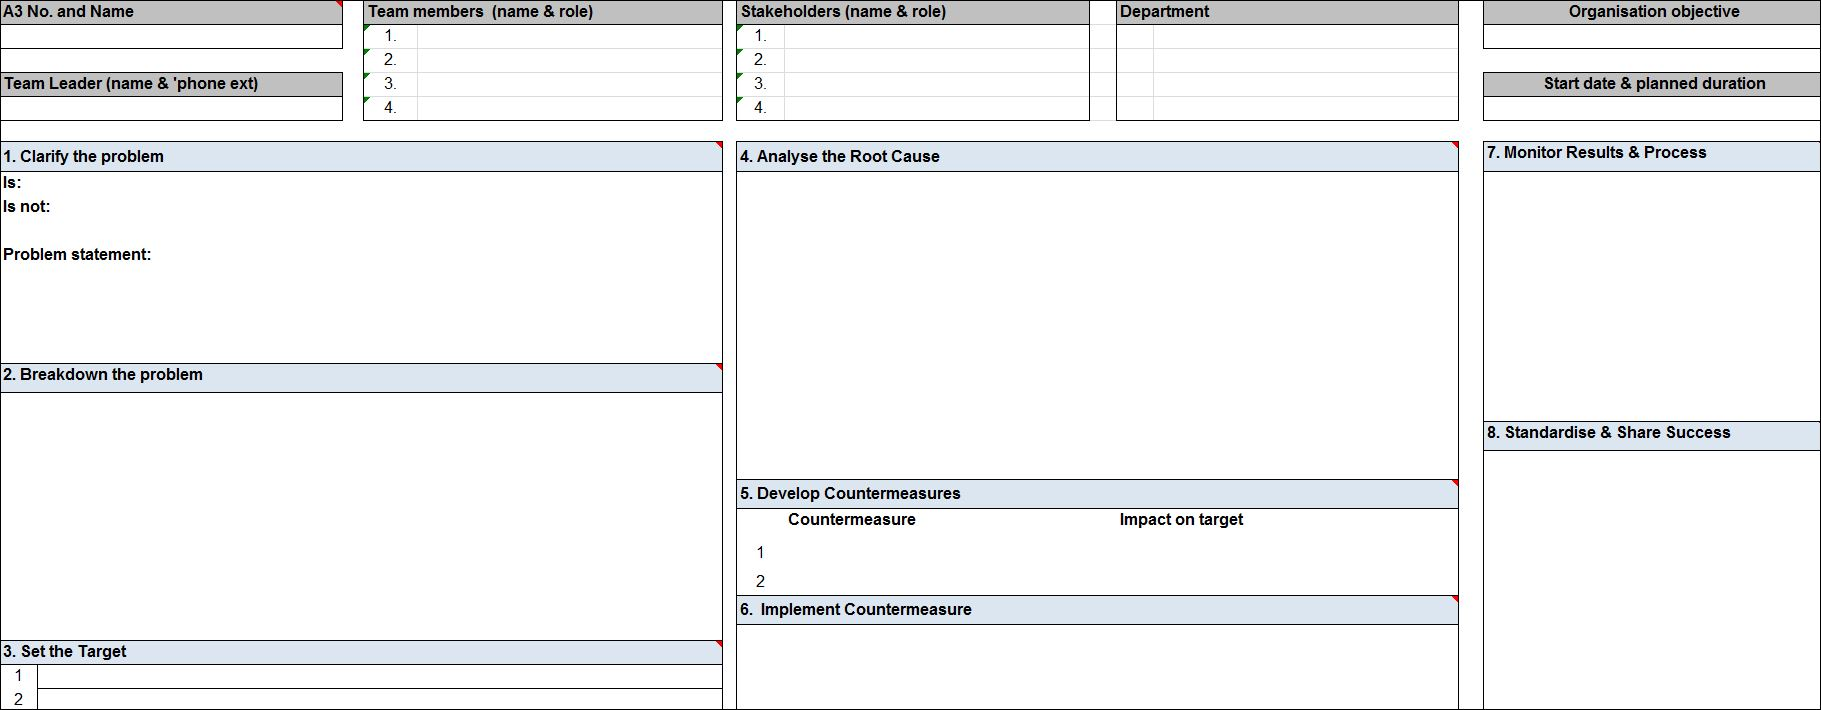
24. A3 reporting
A3 is a reporting templatye developed by Toyota, popular because:
- it is simple and easily applicable
- engourages users to be short
- engourages users to visualize sata
- it offers a logical structure following the Plan-do-check-act (PDCA) cycle
- it emphasizes scientific thinking
It is often used:
- when a problem is more complect
- when personal development is important
- when it is important to capture knowledge for future use
25. 5s
5s is a workplace organization concept derived from five Japanese words:
- Seiri (Sort): sort things at your workplace and understand what is actually needed
- Seiton (Set): order things to reduce time spent on non-value adding activities
- Seiso (Shine): clean the workspace
- Seiketsu (Standardize): maintain the first three pillars by creating a consistend approach to completing tasks
- Shitshuke (Sustain): maintain the previous 4s and make the habit of maintaining correct procedures.
Indirectly, 5s results in the following:
- better safety
- reduced delivery times and processing costs
- improved product quality
- increased workers satisfaction
26. Problem Solving Methods
Plan-Do-Study-Act (PDSA) (or Plan-Do-Check-Act (PDCA))
- Define the problem
- Analyzing the problem
- Identify causes
- Plan counter-measures
- Implement measures
- Standardize new processes
- Define, Measure, Analyze, Improe and Control
- data drien, customer and measurement focused
Ford's Eight Disciplines (8Ds) It identifies root causes using statisical methods, correct and eliminate them using permanent corrective actions.
- Build a team
- Define a problem
- Implement a containment actoin
- Determine the root cause
- Verify the root cause
- Implement the corrective action
- Ensure prevention
- Congraturale the team
27. Triz
TRIZ is defined as the Theory of Inventive Problem Solving .
TRIZ states that technological progress and innovations are not random processes but rather governed by scientific rules (and can be then predicted).
According to TRIZ, to be truly innovative and creatie, a systematic and structured way of thinking must be followed:
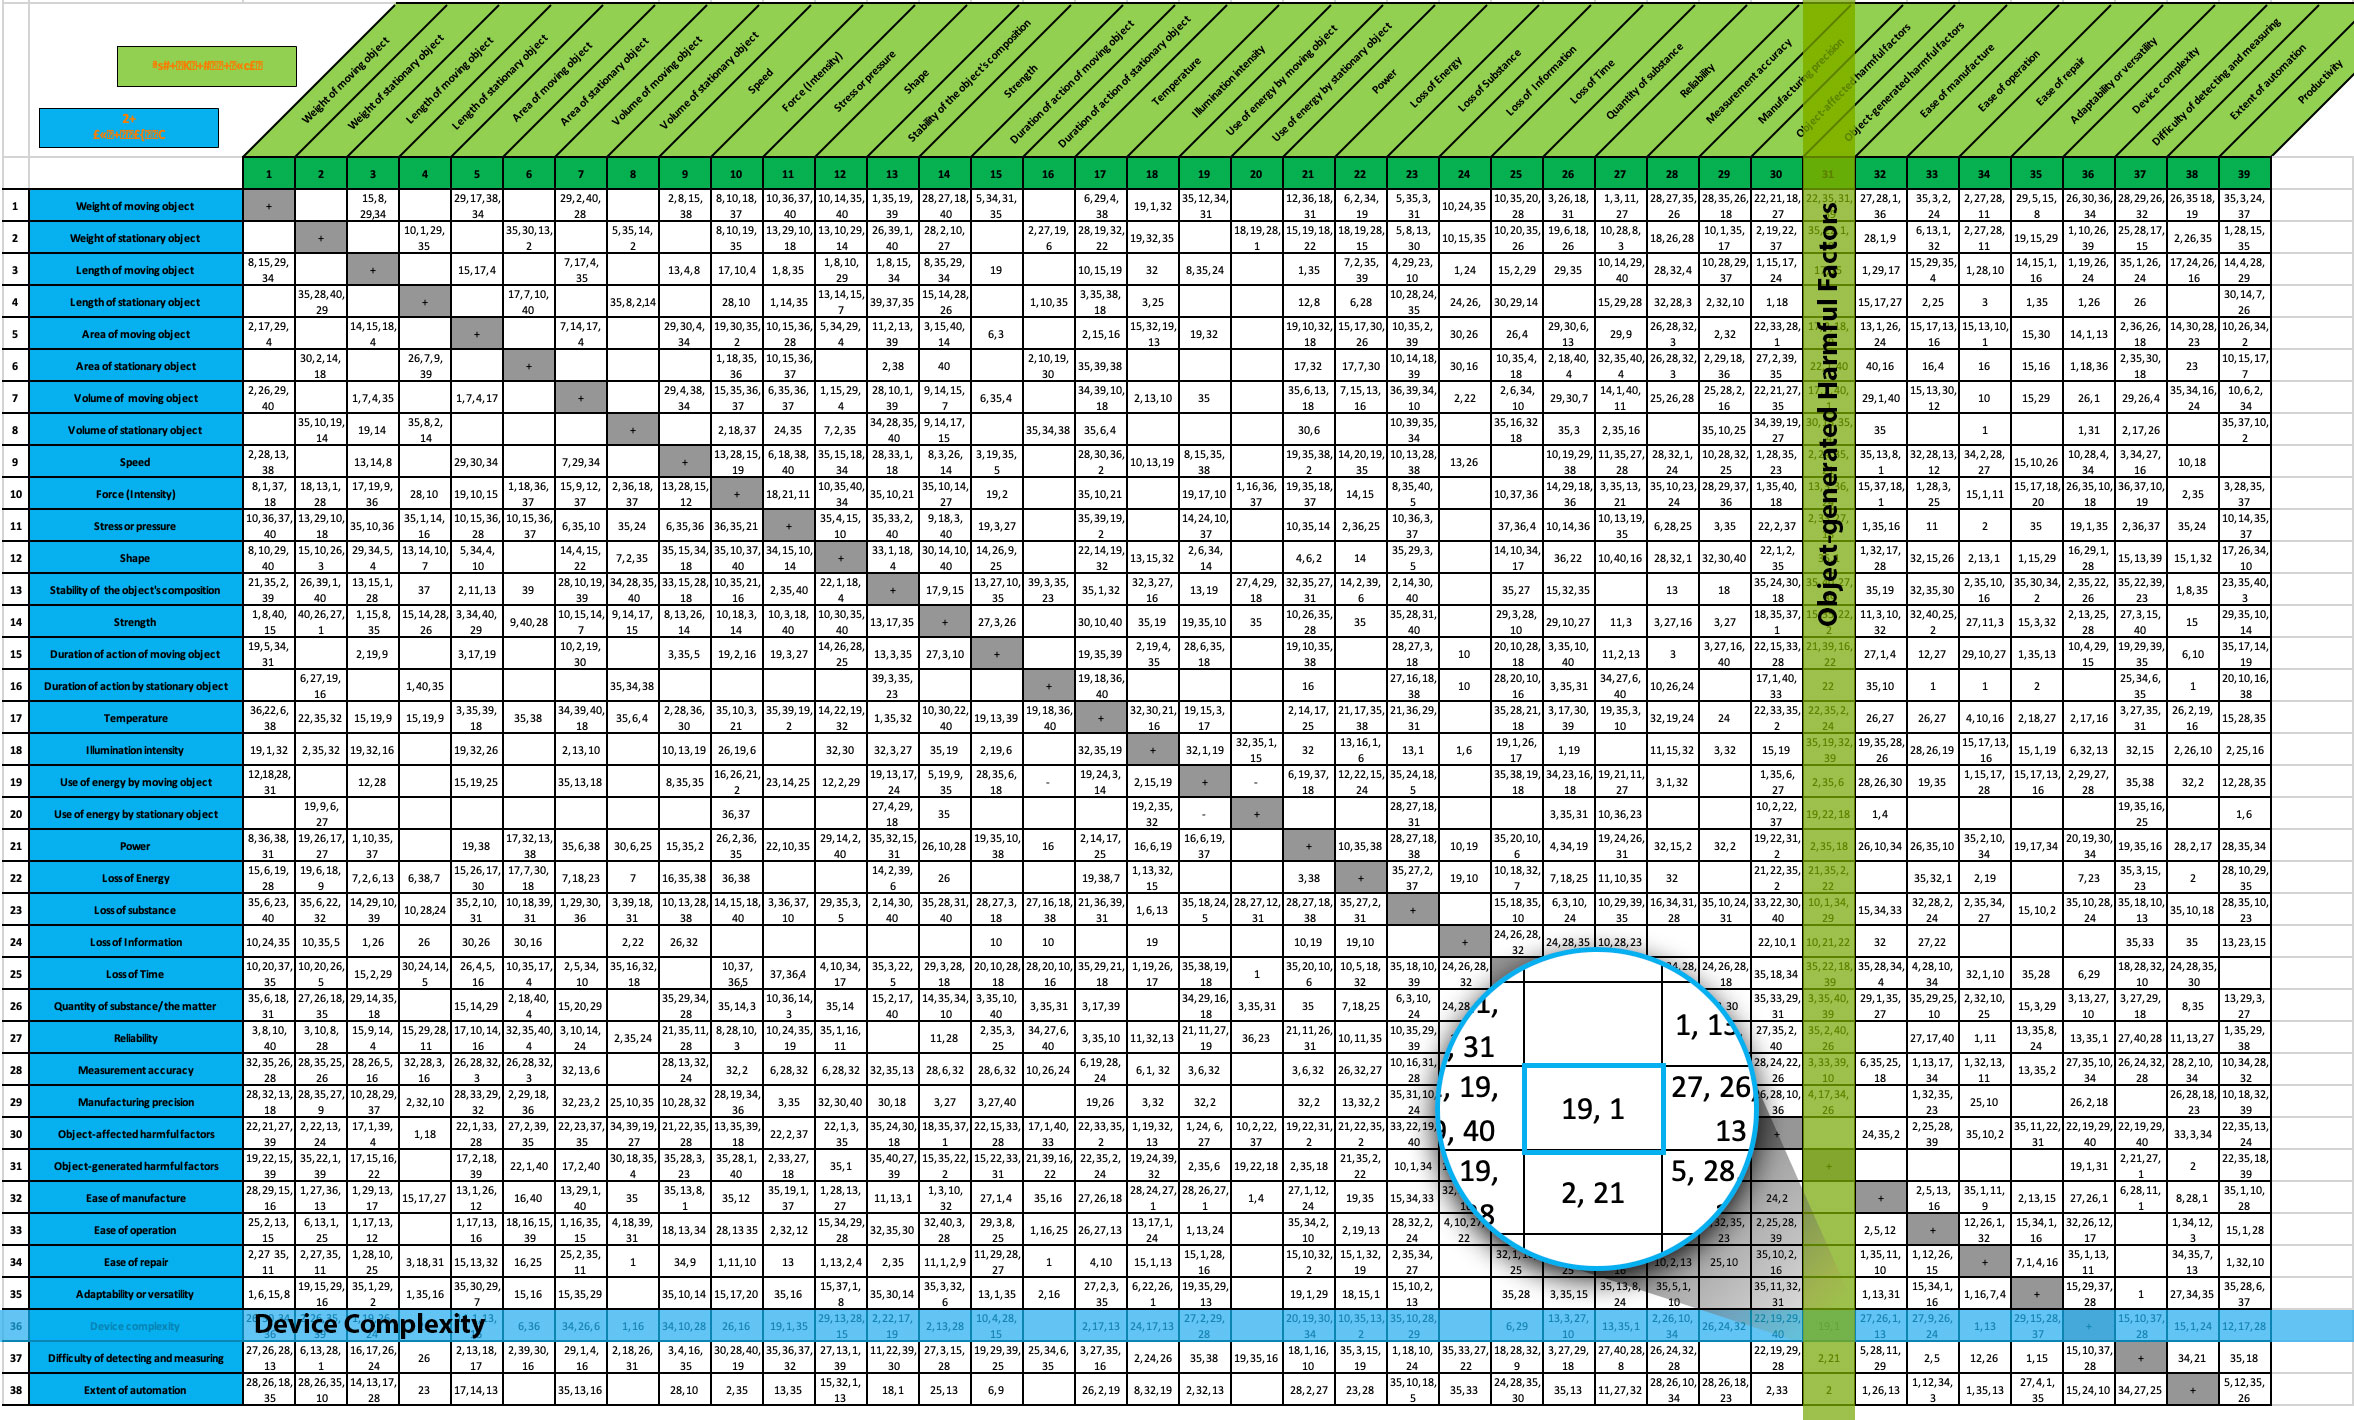
- identify a specific problem (usually defined as a contradiction)
- contradictions are identified in the TRIZ Matrix
- columns represents the features to change
- rows represent the undesirable results
- in each cell (intersection of specific feature to change and undesirable result) there are some numbers
- each number represent a set of principles/methods/alghoritms to apply to sole the problem
- develop a particular solution tailored to your needs doing that, it is possible to achieve an ideal solutions for particular problems, rather than a universal perfect solution.
According to TRIZ, there are two contradictions:
- technical contradictions: when one aspect improves, another declines
- physical contradictions: contradictions between the physical and performance propertries of a product.
The amazing way inventors solve problems
Practice guide to sole problems with Triz