The following notes come from the course Strategic Supply Chain Management, held by S. Wagner at ETH Zurich.
Warning: up to , the following page is 100% content-wise AI-free, so excuse me for human mistakes & typos. Enjoy!
Index:
- Introduction, Supply Chain Basics and Challenges
- Aligning Supply Chain with products and competitive strategy
- Demand Forecasting
- Supply Chain Network Design
- Basic Supply Chain Network Design and Optimization
- Advanced Supply CHain Network Design and Optimization
- Inventory Management
- Coordination in the Supply Chain
- Appendix
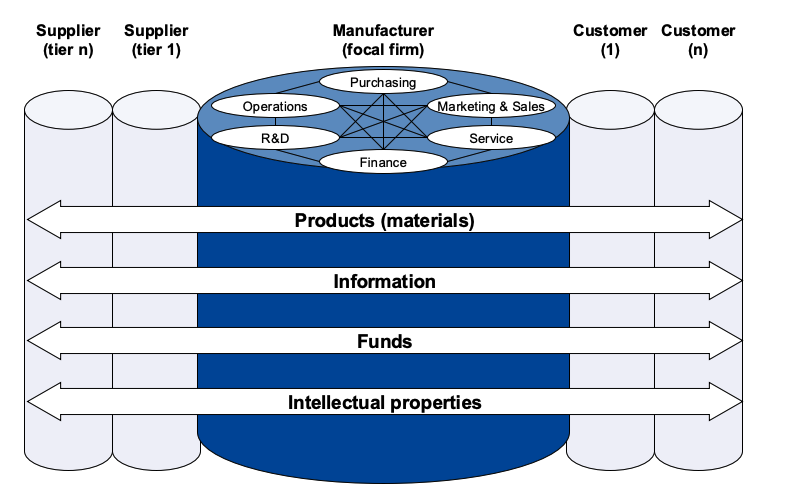
Within a firm, there are several entities that play a role in the supply chain:
- R&D (can improve internal supply chain, design products to optimize supply chain, design products to improve logistic [IKEA example], decide how often develop new products).
- Finance (manage working capital, invoices and account payable/receivable, analyze tariffs and taxes that depend on supply chain, manage FX rate and hedging).
- Operations (manage all the manufacturing and assemplying processes, key components of the supply chain management).
Between all the operators in the supply chain network, there's, in all directions, flow of:
- information
- materials
- money
- intellectual property
SCOR
SCM is often based on the SCOR model (Supply Chain Operations Reference Model) that idenfity 5 key process clusters.
| SCOR Process | Definition |
|---|---|
| Plan | Processes that balance aggregate demand and supply to develop a plan that best fits sourcing, production and delivery requirements. |
| Source | Processes that procure goods and services to satisfy demand. |
| Make | Processes that transform products to a finished state. |
| Deliver | Processes that provide finished goods to the customer (including order, transportation and distribution management). |
| Return | Processes associated with returning products for any reason. These processes extend into post-delivery customer support. |
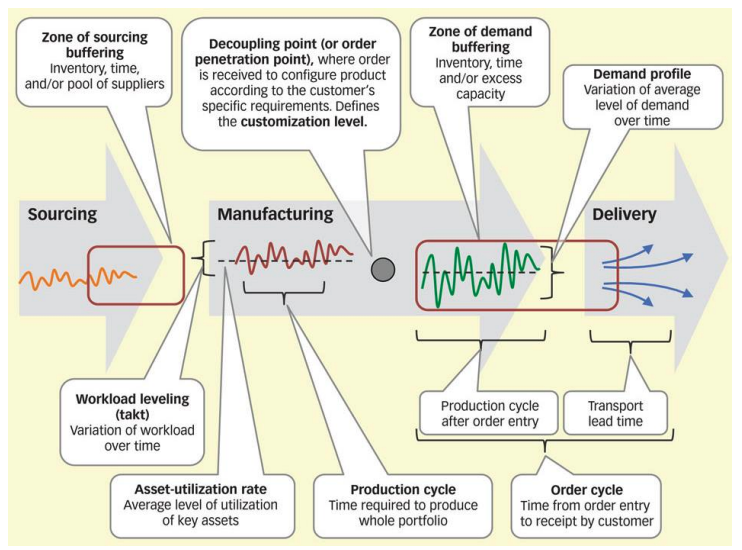
During supply chain management and evalutation, there are different factors to take in account:
-
Sourcing
- Sourcing buffer (inventory, timing, selection of supplies)
- Workload leveling over time
-
Manufacturing
- Decoupling point
- Asset utilization and saturation rate
- Production cycle
- Demand buffering (inventory, timing and excess capacity)
- Delivery
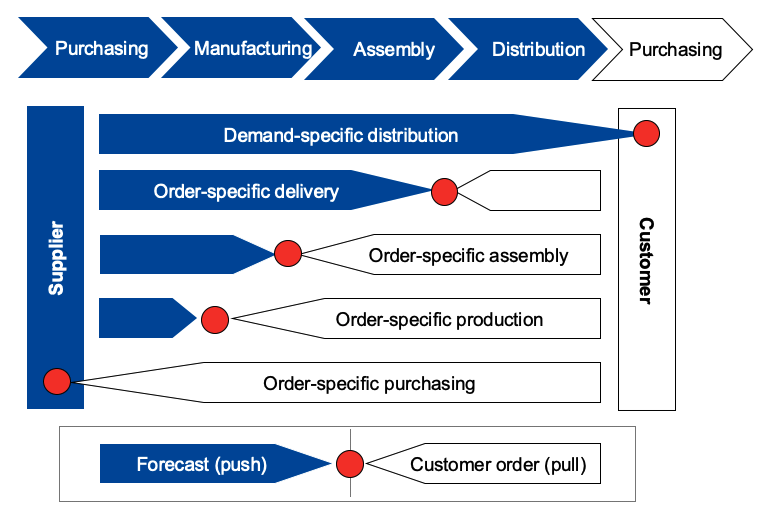
There are two important views to look at supply chain management:
- The Cycle view: each cycles occurs at the interface between to successive stages, it clearly defines processes and people involved, specifiying roles and responsibilities of each time. According to this view, the customer order is the trigger for the whole chain.
- The Pull/Push view: processes belong to one of the following categories depending on the timing of their execution:
- Pull: execution is started in response to a customer order (REACTIVE)
- Push: execution is started in anticipation (SPECULATIVE)
China controls over 90% of the world's rare-eart magnets, creating almost a monopoly for these materials, essential for the tech industry .
The american company MP Materials recently (2025) invested to build a facility in Texas that converts minerals into high-grade magnets, to reduce the dependence on China.
For critical components such those, moving from a "BUY" to a "MAKE" strategy with vertical integration can be strategically both from a business and a political point of view.
Case Study: Tim Cook and the American PoliticsTim Cook's leadership demostrated that supply chain strategy often requires some political legal movements: instead of moving core production to the U.S. (still in India/China due to lower costs), Apple promised $ 600 billion in U.S. investments to gain tariff exemptions.
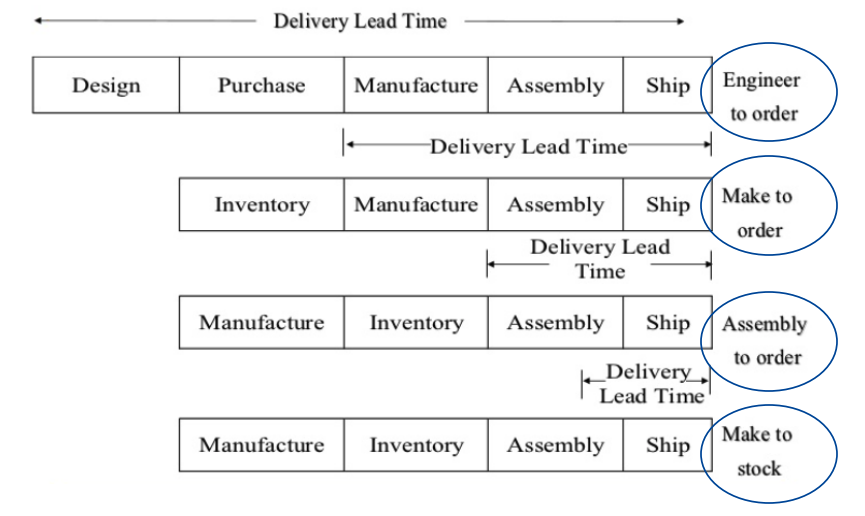
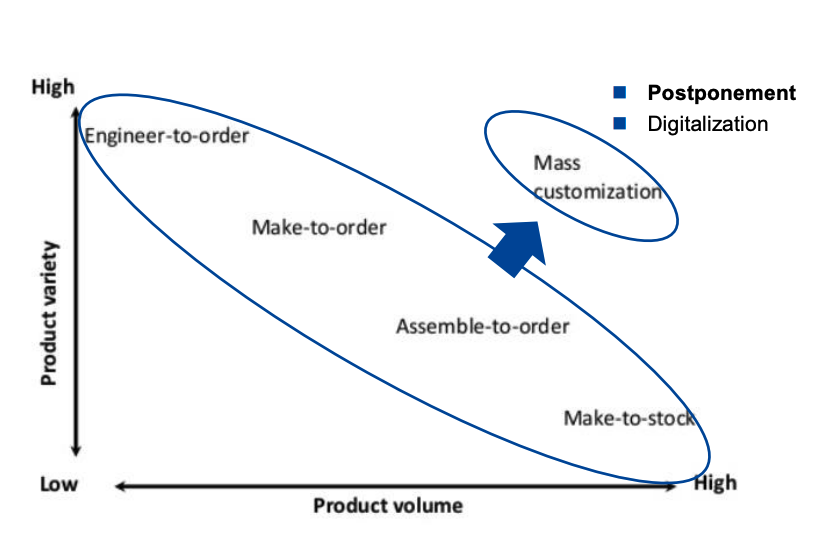
Modularization & Postponmement
Ernst & Kamrad framework describes supply chain structures based on two levels:
- Modularization refers to the degree to which a product is composed by independent and stardadized parts ("modules"). It concerns the relationship with suppliers, designers and materials.
- Postponment refers to the delaying and timing of the final differentiation of the product. It concerns the timing of the assembly, the labelling, the logicist and the distribution.
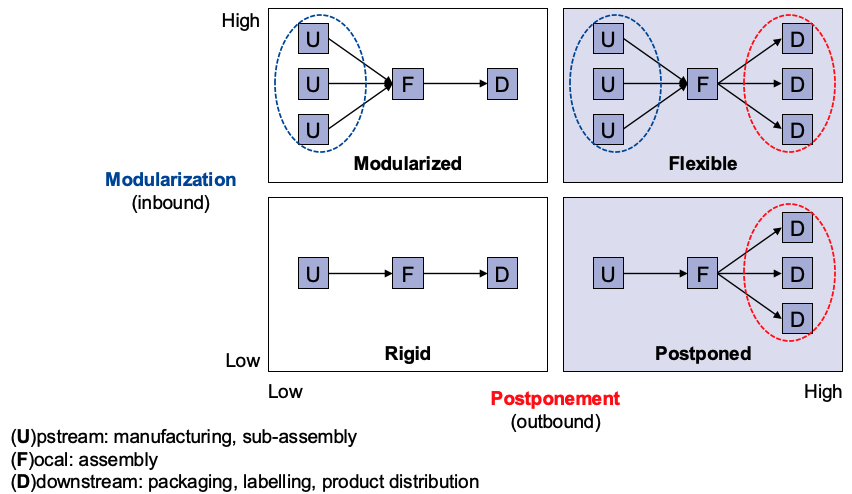
| Structure | Modularity | Postponement | Description | Example |
|---|---|---|---|---|
| Rigid | Low | Low | Focus on mass production and economies of scale. Standardized products, large finished-goods inventory. | Commodities or traditional steel manufacturing. |
| Modularized | High | Low | Focus on outsourcing. The final assembly is relatively early. | Consumer electronics |
| Postponed | Low | High | Focus on logistics efficiency. Products may not be modular, but the firm delays final configuration. | Localized food packaging. |
| Flexible | High | High | Example of mass customization. It combines modular product design with late-stage assembly. | Dell’s build-to-order PC model, customized high-end bicycles. |
Note that postponement can be done at different levels:
- time postponement: delaying the final assembly closer to the customer's order
- form postponement: delaying the product differentiation
- place postponement : delaying and separating the plant where the final assembly is done
Intermediaries outside the firm (wholesalelrs and distributors) can be used to facilitate the postponement.
Postponement comes also with several additional benefits:
- inventory reduction by risk pooling (instead of stocking different variants, a unique base-variant is stored and then differentiated after the order).
- economies of scale and better logistic
- Instead of dyeing cotton and yarn, Benetton makes the sweaters and postpones coloring the inventory.
- The company ships to the stores a limited quantity of sweaters to collect information about customers's tastes.
- The remaining un-colored sweaters is the dyed according to the collected data.
This results in:
- better reaction to customers's demands and trends
- delayed forecasts for specific colors
- ability to still use aggregated demand forecast to start manufacturing early
4 Phases of Supply Chain Management
SCM can be divided in:
- Design supply chain
- Plan supply chain
- Operate (execute) supply chain
- Control supply chain
1. Design supply chain
- Decisions about the structure and the processes each stage will perform
- Design decisions are long term and expensive to reverse
- Design must support strategic objectives and take into account market uncertainty
2. Plan supply chain
- Contrained by the configuration from the design phase
- Master planning with monthly and weekly time horizon
- Several additional contraints to be considered: demand uncertainty, exchange rates, capacity contraints ...
3. Operate (execute) supply chain
- Contrained by the previous phases
- Time horizon: weekly and daily
- The goal is to implement operating policies as effectively as possible
- Decisions regarding individual customer orders
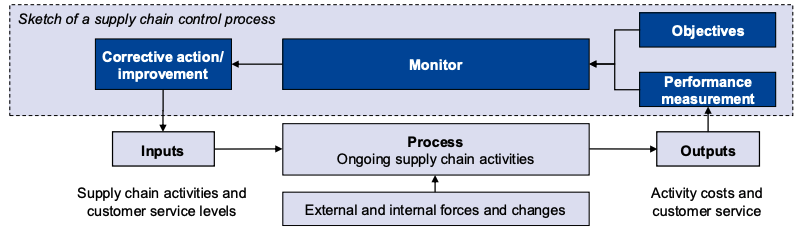
4. Supply chain control
- Control and performance measurement are essential to keep the plan in line with the objectives
- Anything measured improves
- What you measure is what you get
- You can't improve if you don't measure!
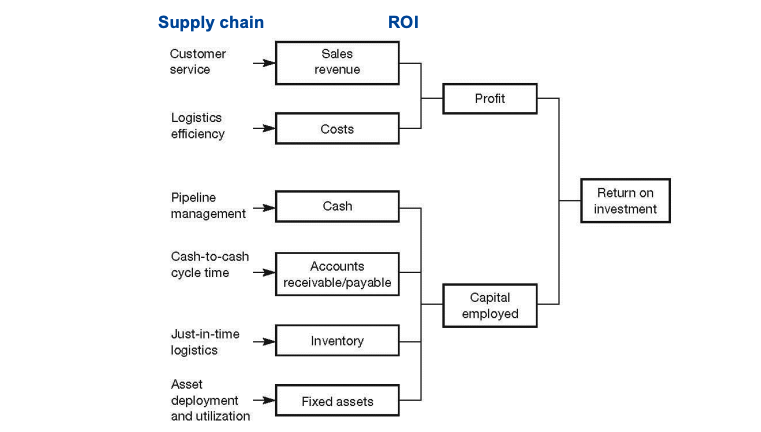
Measuring SC performance
Some frequently used KPIs:
share of orders delivered without any mistakes in product, quantity and quality. share of orders delivered on or before the committed delivery date how many times inventory is sold and replaced over a pediod time it takes from receiving an order to fulfilling itSuppy chain metrics often need to be translated in financial metric in the balance sheet:
- Order Cycle time Cash (Assets, Balance Sheet)
- Invoice Accurary Receivable (Assets, Balance Sheet)
- Inventory Inventories (Assets, Balance Sheet)
- Distribution facilities, equipment and plants Property (Assets, Balance Sheet)
- Purchase order quantities Current Liabilities (Liabilities, Balance Sheet)
- Financing options for inventory and plants Debt and equity (Liabilities, Balance Sheet)
Developments and trends influencing supply chain today and in the future
| Areas of Change | Potential issues |
|---|---|
| Demographic change | buying behavior, e-commerce, urbanization, city logistic |
| Economic change and protectionism | regional competitive advantages, inflation, trade flows and tariffs |
| Volatility | demand, fx rates, political systems |
| Sustainability | climate change, footprint, resource scarcity |
| Innovation in SC | design in manufacturing, assembly, logistic, IP, startup in SC, risk & revenue sharing |
| Digitalization & AI | sc 4.0, robots, drones, 3-d printing, blockchain, big data, AI... |
2. Aligning Supply Chain with products and competitive strategy
A "typical" value chain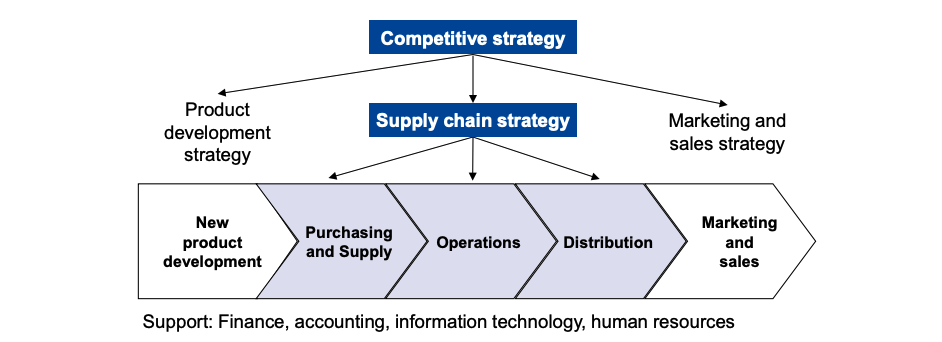
There's consistency and support between competitive strategy, supply chain strategy and other functional strategies.
- competitive strategy defines the set of customer needs to satisfy
- product development strategy defines the portfolio of products to develop
- marketing & sales strategy specifies how to segmenent the market and position the products
- supply chain strategy determines material purchasin, manufacturing, assemplying, delivering etc...
Strategic fit occurs when there's consistency and common goals between them but, how is this achieved?
1. Understanding customer needs
Identification of the need of the customer segment, based on individual attributes (quantity needed, response time tolerated, variety needed, service level required, price, rate of innovation etc...)
- Demand uncertainty is the uncertainty of customer demand for a product (as a whole)
- Implied demand uncertainty is the resulting uncertainty given the customer attributes and the portion of the demand the supply chain has to handle (combined metric taking into consideration also the supply chain and the firm: not about how much is sold, but more about how it is sold)
Some factors that increase implied demand uncertainty:
- range of quantity increases great variance in demand
- lead time decreases less time to fulfill orders
- required service level increases the firm has to handle unusual and more problems
- rate of innovation increases new products have naturally more demand uncertainty
- number of sale channels or distributors increases total customer demand is more disaggregated
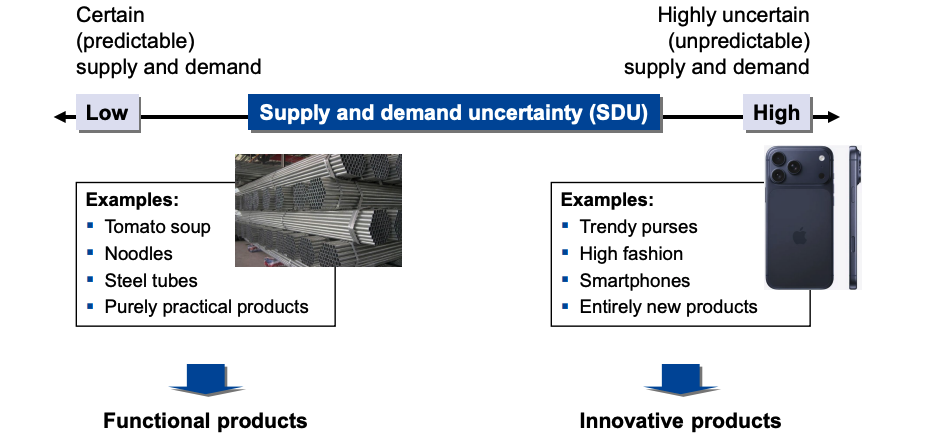
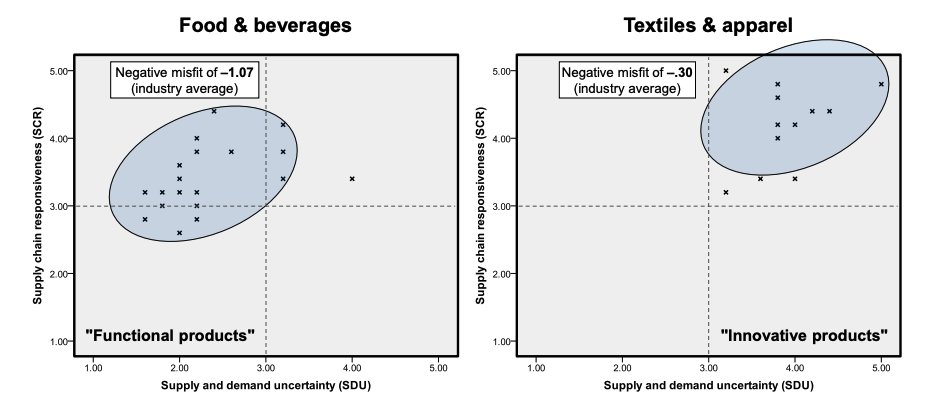
Uncertainty is often correlated with other SC metrics:
| Attribute | Functional Products (Low SDU) | Innovative Products (High SDU) |
|---|---|---|
| Product Margin | Low (5-20%) | High (20-60%) |
| Product Life Cycle | Long (more than 2 yrs) | Short (3 month - 1 yr) |
| Avg. Foreacast Error | 10% | 40-100% |
| Avg. Stock Out Rate | 1-2% | 10-40$ |
| Avg. Forced Season-end Markdown | 0 | 10-25% |
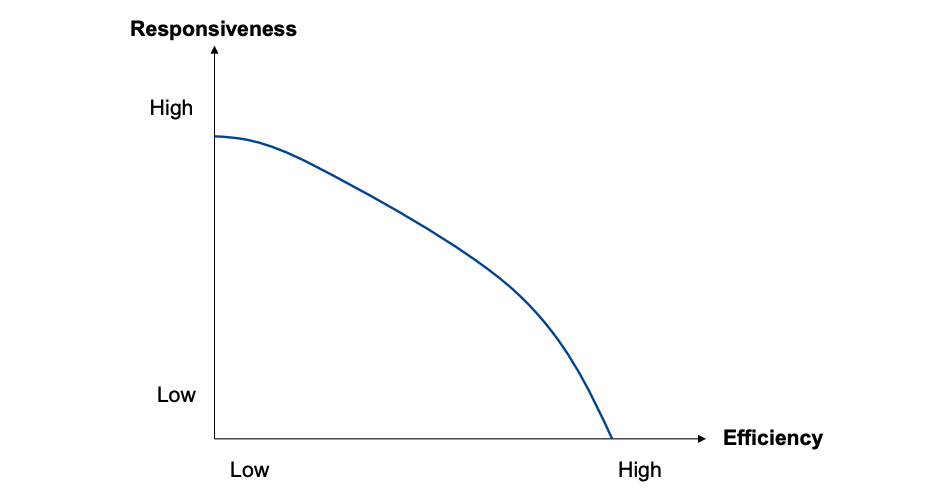
2. Understanding the supply chain
After understanding the customers, next question is: how does the firm best meet demand?
The dimension/metric describing best the supply chain is supply chain responsiveness, that is the ability to:
- respond to wide ranges of quantities
- meet short lead times
- handle different products
- design and deliver innovative products
- provide a very high service level
Note that:
Zara keeps the decoupling point very early in the process: products leave the fabric undyed and are completed once a trend is spotted (form postponement).
This is an example of high implied demand uncertainty: local manufacturing, express delivery and centralized distributions centers (both to maintain high visibility and fast lead times) are critical in this kind of market.
Zara's Supply Chain [SCM GLOBE].
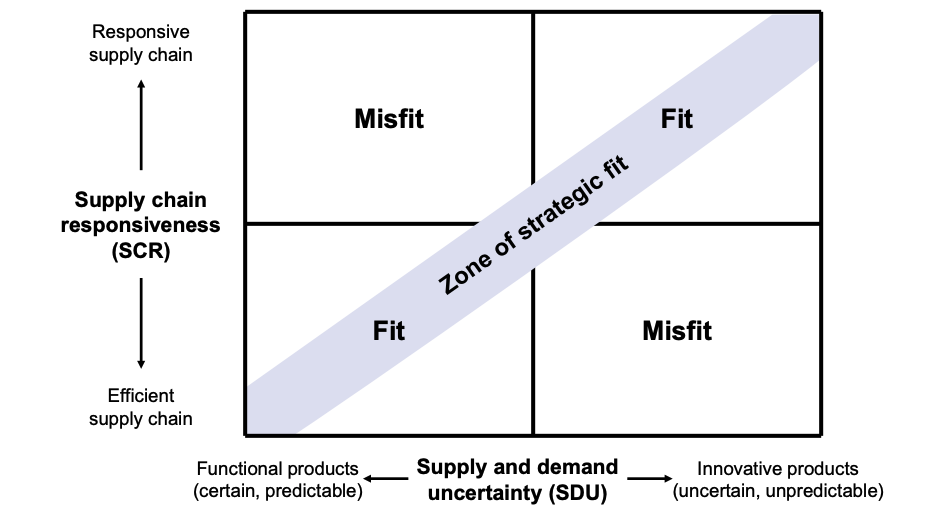
3. Achieving strategic fit
To ensure that the supply chain performs well and it is consistent with targer customer needs, all functions (operations, finance, purchasing, distribution etc...) must support the competitive strategy.
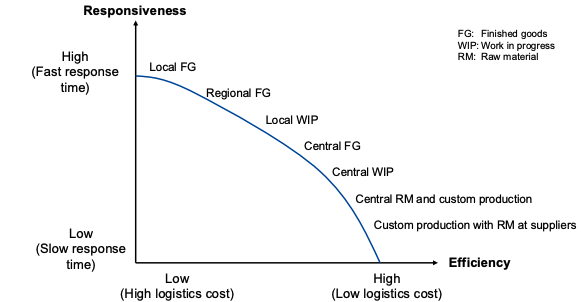
Below some design priciples that show the comparison betwee efficient and responsive supply chains:
| Aspect | EFFICIENT | RESPONSIVE |
|---|---|---|
| Manufacturing | High utilization | Capacity flexibility |
| Inventory | Minimize inventory | Buffer inventory |
| Lead time | Reduce NOT at expense of greater costs | Reduce at ALL costs |
| Supplier selection | Sufficient quality & cost | Speed, flexibility, quality |
| Trasporation | Low cost modes | Responsive and fast modes |
| Product design | Integral design to minimize product cost | Modular design to allow postponement |
Some other issues affecting strategic fit:
- competitive strategy and market scenario may change over time
- more competitors and increasing internet sales may result in increased variety in demand supply chain must change to adapt
- supply chain must evolve during product life cycle
- diminishing control over the supply chain (fragmentation, globalization and more supply chains)
- increasing implied demand uncertainty (more demanding customers, shorter product life cycle, increasing variety)
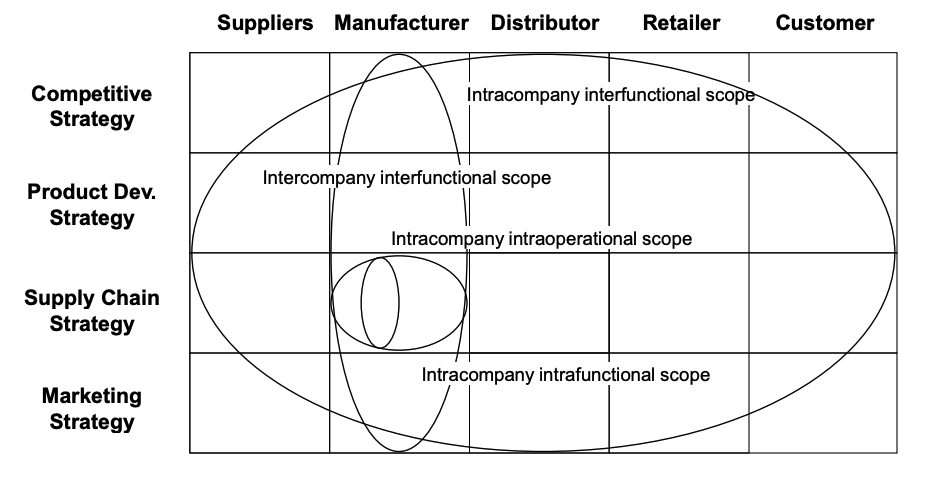
The Strategic Scope
Different entities in the supply chain (suppliers, customer, manufacturers etc...) have different objective: expanding the strategic scope and vision is then necessary.
- : one operation in a functional area of the company
- : all operations in a functional area
- : all functional strategies in a company
- : all functional strategies in all the companies/agents involved
Drivers of SC Performance
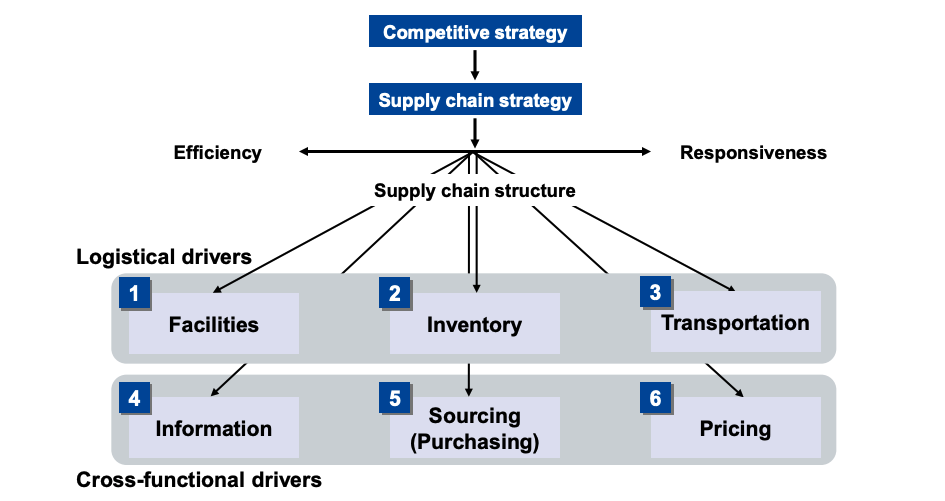
- The "where" of the supply chain
- Purposes:
- manufacturing and assemblying facilities
- warehouses
- They determine the supply chain long term
- Key factors to consider: location (centralization vs decentralizatoin), capacity, manufacturing method (product vs process focused), warehousing methology (cross docking, automated guided vehicle, picking etc...).
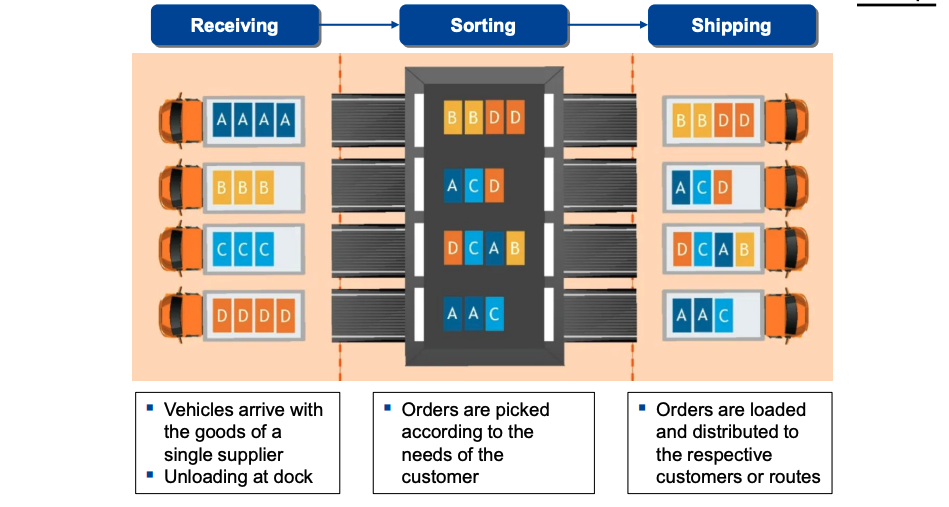
Cross-docking is common in different industries, including retail stores, ecommerce companies, manufacturers and logistics service providers (LSPs).
Products move right from the inbound to the outbound dock without every staying in the warehouse, achieving faster delivery, less warehouse space, optimized inventory level, lower trasporation and labor cost.
- if responsiveness is a priority large number of smaller facilities, decentralizatoin
- if efficiency is a priority small number of larger facilities (economies of scale), centralization
- Inventory exists because of a mismatch between supply and demand
- Different types of inventory (raw materials, WIP, finished goods)
- The level of inventory has impact on:
- Material flow time: time between materials entering the sc and exiting the supply chain
- Throughput: rate at which sales occur in a timeframe (e.g. 8 units/day)
There are different components in inventory decisions:
- Cycle inventory: average amount of inventory used to satisfy demand (depends on lot size)
- Safety inventory: held in case demand exceeds expectations (tradeoff needed between its cost and the cost of losing sales)
- Seasonal inventory: built up to cover predictable variability and seasonality in demand (tradeoff needed between its cost and the cost of flexible production)
As before:
- if responsiveness is a priority large buffer inventory, locate inventory close to customers
- if efficiency is a priority reduce and centralize inventory
3. Trasporation: role in the supply chain
- The "how" of the supply chain
- Purposes:
- Moving the products between stages
- Allowing "disintegratin" of the supply chain
- It determines the supply chain at medium term
Key factors to consider:
- trasporation mode
- route and network selection
- in-house or outsource
- if responsiveness is a priority faster trasporation (express, air cargo), given that the customer are willing to pay for it
- if efficiency is a priority slower trasporation modes (sea, road), for customers whose priority is price
4. Information: role in the supply chain
- Data analysis regarding inventory, trasporation, facilities and connection between different stages coordination between stages
- Crucial to daily operations at each stage
Key factors:
- MRP (Manufacturing Resource Planning) forecast, aggregate planning _(PUSH system)_According
- Sales and Operations Planning (S&OP)
- Enabling technologies _(blockchain, ML, Gen AI, Radio Frequency Identification, IoT, Cloud...)
Information and data analysis allow supply chain to become more efficient and responsive at the same time.
5. Sourcing (Purchasing): role in the supply chain- Set of business processes required to purchase:
- goods
- services
- logistic services
- sourcing decisions are determinant for:
- degree of vertical integration (in-house vs outsource)
- sourcing strategy (single vs multiple)
- number of suppliers
- contract with suppliers
- if responsiveness is a priority supply network focuses on high quality, speed and flexibility (intensive supplier integration in logistic)
- if efficiency is a priority supply network focueseson "sufficient" quality and cost (suppliers pool, economies of scale, negotiating power)
Example: Vertical Integration vs Outsourcing
Unlike traditional automotive companies (Ford, VVW) that outsource 80% of the components, Tesla "makes" its own parts (including seats, batteries, engines and even software and accessories) to reduce supply risk and capture.
Also, in doing that, Tesla maintains IP and avoid the "double marginalization" effect (when both supplier and buyer add profit margins, resulting in a higher cost for the final customer).
- Pricing strategies can be used to:
- match demand and supply
- differentiate customer segments
Key Factors to consider:
- pricing and economies of scale
- everyday low-pricing vs high-low pricing
- fixed price vs menu price
- differential prices (e.g. depending on customer segments, response times)
3. Demand Forecasting
Different forecasting horizons:
- Strategic (3+ years): new products planning, facility location, research and development
- Tactical (3 months - 3 years): sales and production planning, budgeting
- Operational (Up to 1 year, generally up to 3 months): purchasing, job scheduling, workforce and production levels, job assignments
Demand forecasting is calculating or predicting future demand of a product or service, usually as a result of study and analysis of available historical data.
Consequences of bad forecasting:
- Major financial impact excess recourses, unsold products or lost profits and customers
- Misallocation of resources
Overview of Forecasting Methods
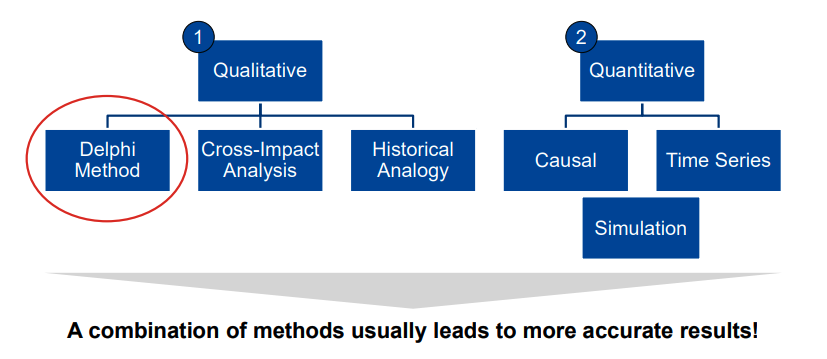
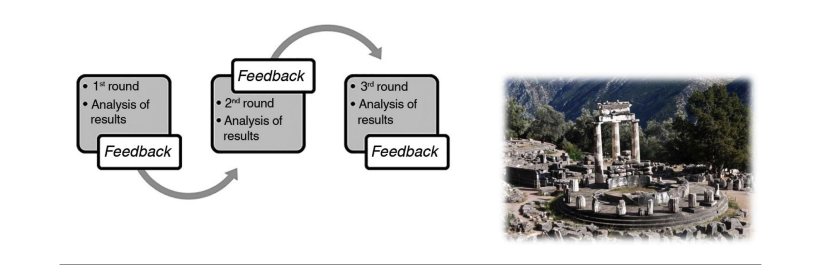
The Delphi Method This method is a structured communication technique, originally developed as a systematic, interactive forecasting relying on a panel of experts.
Causal model This method predicts one parameter as a function of others
Often, we assume a linear model:
Time-Seies Method- is the expected value of demand (influenced by level, trend and seasonality)
- is the part of the forecast that deviates from systematic component
The forecast error is the difference between the forecast value and the actual value
A time series is a collection of past (historical) data from which we want to isolate patterns and use them to predict future data.
Some time-series models:
Moving AveragesLevel in period is the average demand over the last values:
- easily understood and computed
- provides a stable forecast
- lags a trend
- ignore complex relationship in data
Simple Exponential Smoothing
It is used when demand has no observable trend or seasonality.
- Start with a initial estimation of level , assumed to be the average of historical data:
After observing demand , revise the estimates of level by making a weighted adjustment:
with
- large number of periods taken into consideration small
- Low when data are fairly stable
- High when data are unstable
| Method | Features |
|---|---|
| Moving Average | No observable trend and seasonality |
| Simple Exponential Smoothing | No observable trend and seasonality |
| Trend-Corrected Exponential Smoothing | Trend but NOT seasonality |
| Trend-Seasonality Corrected Exponential Smoothing | Trend AND Seasonality |
In particular, some common methods are:
- Winter's Method for demand WITH trend and seasonality.
- Holt's Model for demand with trend but NOT seasonality.
4. Supply Chain Network Design
A distribution channel is a network of interdependent entities involved in the process of making a product available on the market.
Distribution channel are often combined in a distribution mix.
In any distribution channel, different intermediaries play a role:
- wholesalers buy and sell products in bulk to other businesses for resale to a final customer
- retailers sell products directly to customers
- distributor act as middlemen between manufacturers and business customers.
- agents/brokers are independent sales represantives.
In general, intermediaries can carry out a large number of functions and bring several additional benefits::
- promotions, closer contact to the customer, marketing and negotiation
- reduction of channel transactions for the manufacturer (the manufacture just ships to the intermediary that delivers to different and far customers)
- risk taking (associated with the inventory, the risk of obsolescence and theft)
Three main distribution strategies:
- Intensive: a product is distributed by wholesales/retailer through as many channels as possible (coca cola, mars)
- Exclusive: a wholesaler/retailer receives the exclusive right to sell the product for a geographical area (franchises: burger king, mcdonald)
- Selective: a company uses a limited number of selected wholesalers/retailers who whill give specific attention to the product (swatch, ralph lauren)
Retail channels of distribution and sales:
- Online
- Brick-and-mortar: business with physical presence
- Omnichannel: flexible supply of orders to stores and online with the same catalog, one software platform to manage everything (info is freely shared and visible)
- Multichannel: separated distribution channels to satisfy different kinds of shoppig experience (online catalog is different), stores have their own stock and online stores are separate entities
In last years, supply chain disintermediation became more popular:
- the consumer directly deals with the manufacturer
- removal of the indermediaries from the supply chain
- "following the financial industry": investors became able to invest directly into financial products, without the need of an advisor or broker
This model was possible thanks to:
- digitalization and new business models (direct online sales)
- diminished value intermediaries bring to the supply chain
Example: Target (USA)
Target, the famous US retailer uses its phisical stores as local fulfillment centers for online orders.
This is an example of place postponement and inventory pooling: by using stores as warehouses and having a unified "inventory view", they reduce last mile shipping costs and obtain better real-time data and forecasts.
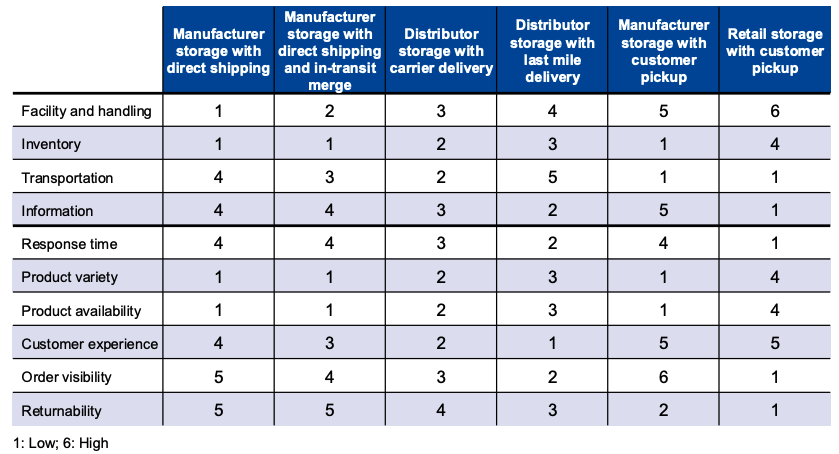
Evalutating Distribution Networks
Distribution networks can be evalued along the following performance measures:
- Customer needs that are met (customer service) revenues
- Cost of meeting customer needs cost
Elements of customer service influenced by the supply network:
- response time
- product variety and availability
- customer experience
- order visibility
- returnability Costs of meeting customer needs ( supply chain costs) are influenced by:
- facilities
- inventories
- trasporation
Note that, in supply chain and trasporation, there are not economies of scale:
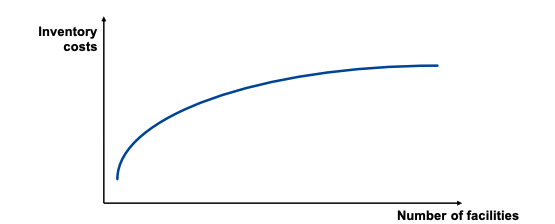
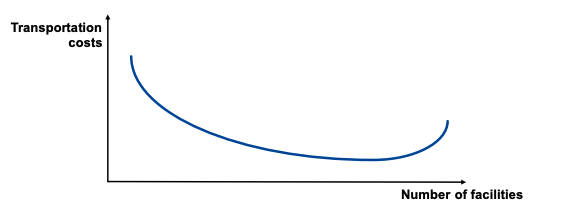
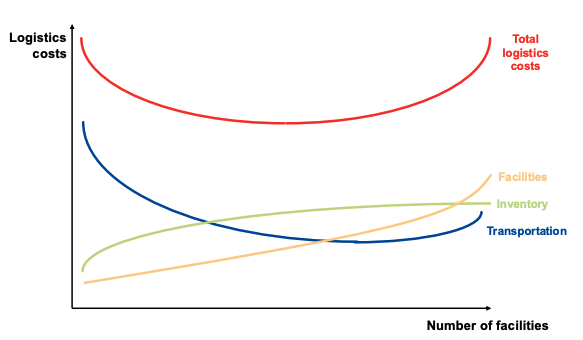
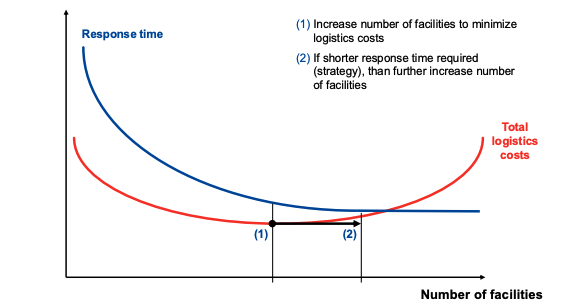
To minimize the total cost:
- have the least number of facilities that minimize the logistic cost
- if a firm wants to reduce the response time, it may have to increase the number of facilities beyond the point that minimizes logistics costs
- facilities should be added beyond the minimizing cost point only if they increase profits
Factors influencing Supply Chain design
- facility location
- market and supply allocation
- facility role (which processes are performed)
- capacity allocation
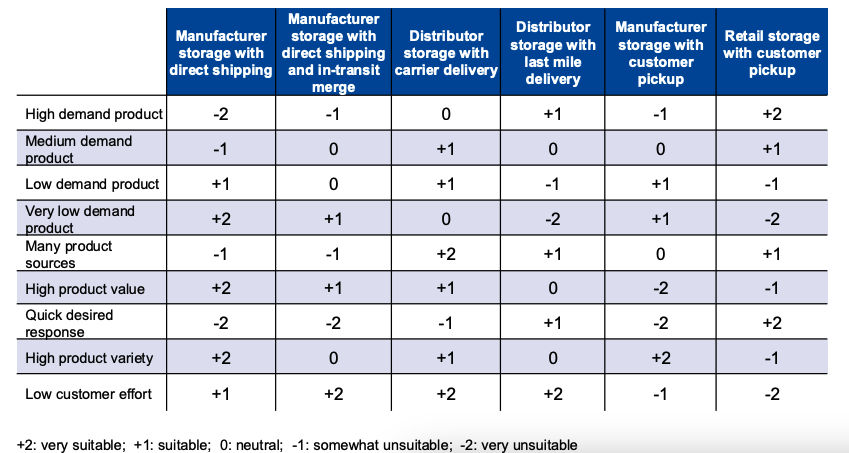
Below some selected options for supply chain network design:
1. Manufacturer storage with direct shipping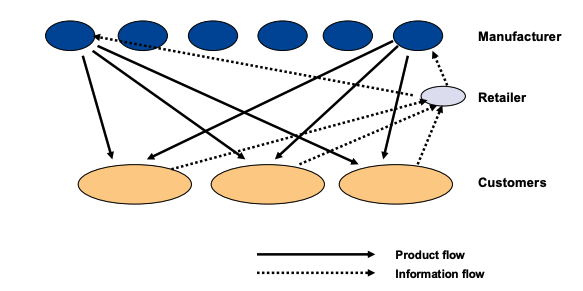
- Retailers send single unit orders for products to manufacturers, that directly ships the product to the customer.
- The retailer is only focused on sales and advertising.
Performance characteristics:
- lower facility and inventory cost because of aggregation
- higher trasportation cost because of disaggregate shipping
- significant investment in information system
- easy to provide high variety and high product availability
Example: Macbook from Apple
When a custom-configured Macbook is ordered from Apple's website, the product is often shipped directly from a factory in China , (Foxconn). Apple (the retailer) holds zero inventory for the custom units.
Note that this is a common apèproach for "long tail products" with high variety but low individual volume.
More details about Apple's supply chain .
2.Manufacturer storage with direct shipping and intransit merge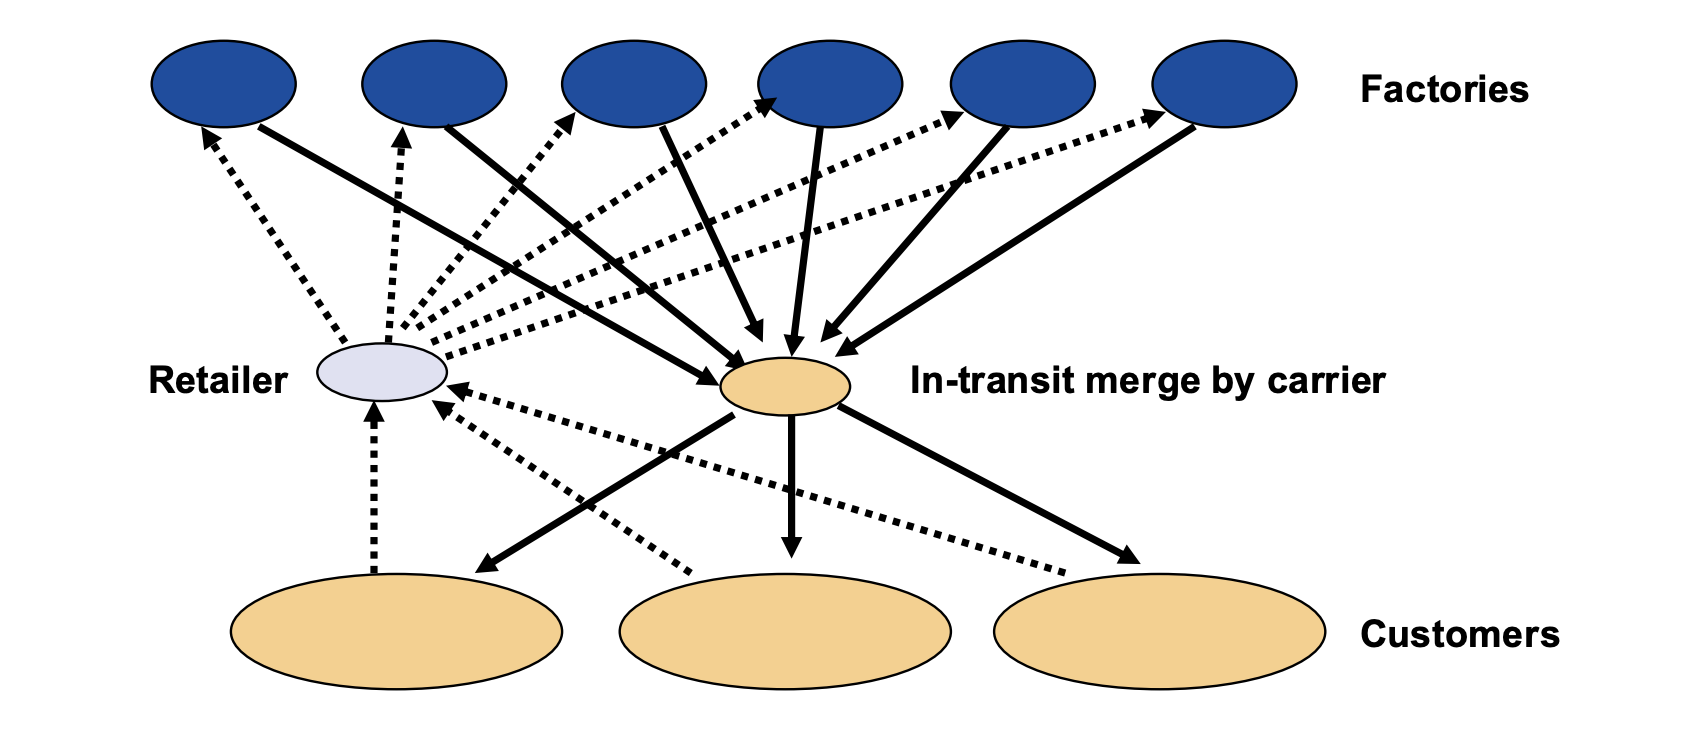
- In-transit merge combines orders coming from different locations so that the customer gets a single delivery.
- It is usually used by direct sellers and drop shipping.
- Example: a customer ordering a DELL PC, a Sony Monitor, a logitech keyboard; then merghe them at the hub before making the final delivery
Performance characteristics:
- Facilities and handling cost higher than drop shipping
- Other metrics are similar to dropshipping
3. Distributor storage with carrier delivery
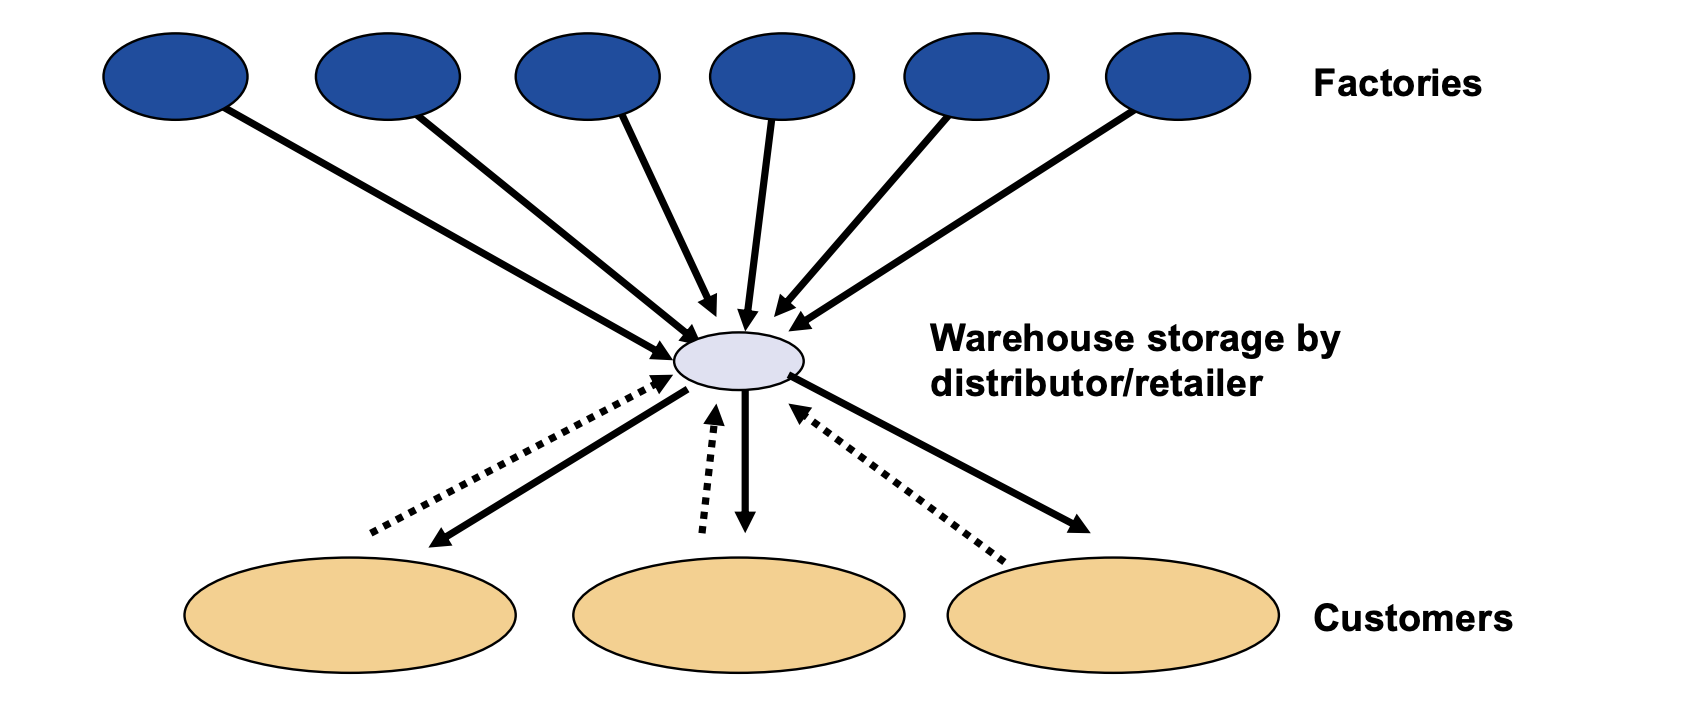
- Inventory is not held by the manufactures, but distributed between retailers in intermediate warehouses.
- Package carriers transport the products from the intermediate location to the customers (example: Amazon)
Performance Characteristics:
- facilities and inventory costs are higher than manufacturer storage
- transportation costs are lower than manufacturer storage
- lower response time than the manufacturer storage
- better customer experience than the manufacturer storage
- lower product availability and variety than the manufacturer storage for the same cost
Example: Amazon's Fulfillment Centers
With high-demand items that need to be close to the factory, Amazon buys products in bulks from several manufacturer and stores, then store them in massive hubs.
When then an order is placed from the website, a local carrier _(Swiss Post, DHL, UPS) picks it from the FCs.
Keeping large quantities in few larger warehouses, Amazon can also the safety stocks required to handle local demand spikes.
More about the Amazon's fulfillment Centers .
4. Distributor storage with last mile delivery
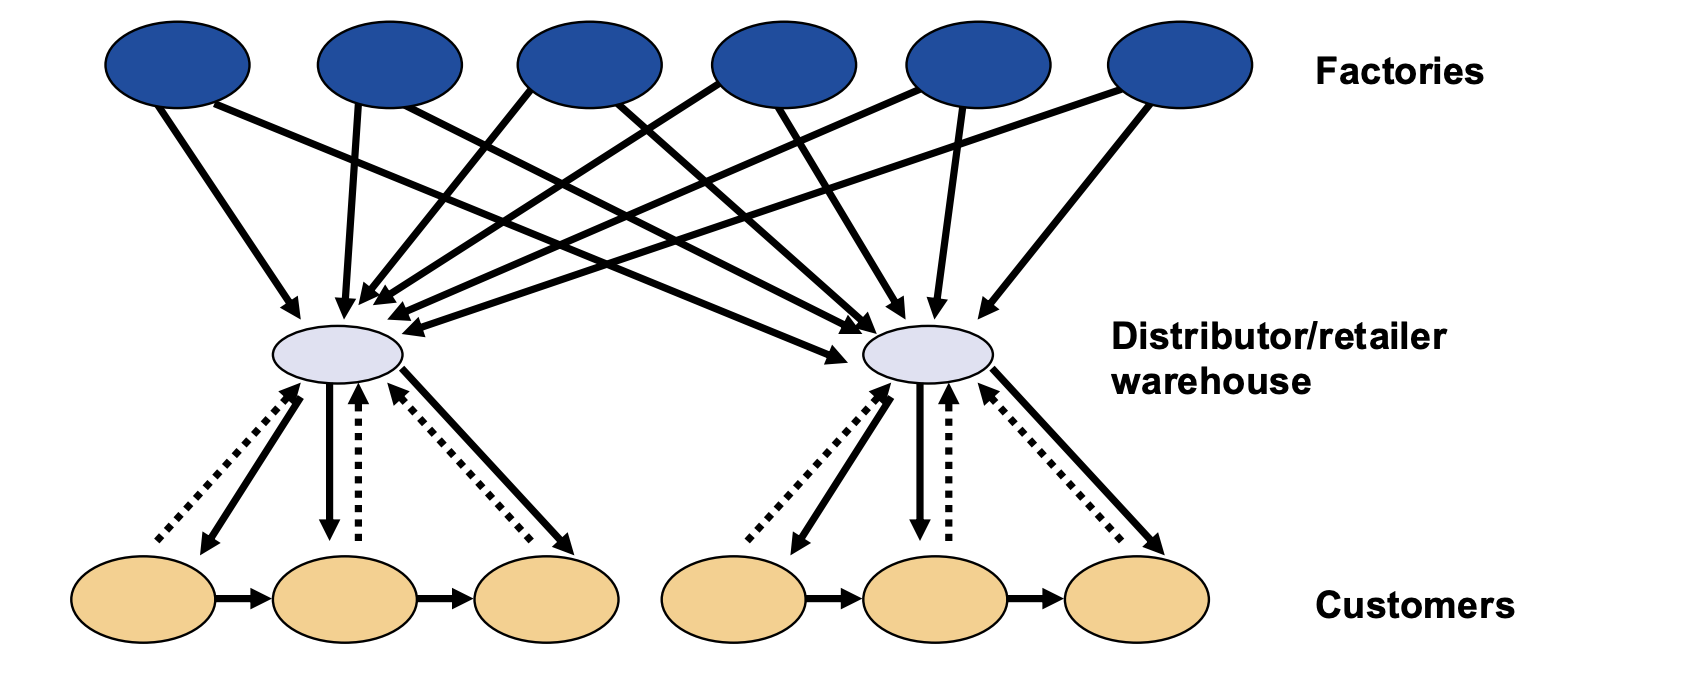
- The distributor/retailer delivers the product to the customer's home instead of a package carrier, requiring the distributor warehouse to be much closer to the customer (and then more warehouses are required).
- Examples: Amazon Fresh
Performance Characteristics:
- higher inventory, facility and trasportation costs
- very quick response time
- product availability is more expensive
- very satisfying customer experience
- product returnability is easy to implement
5. Manufacturer or distributor storage with customer pickup
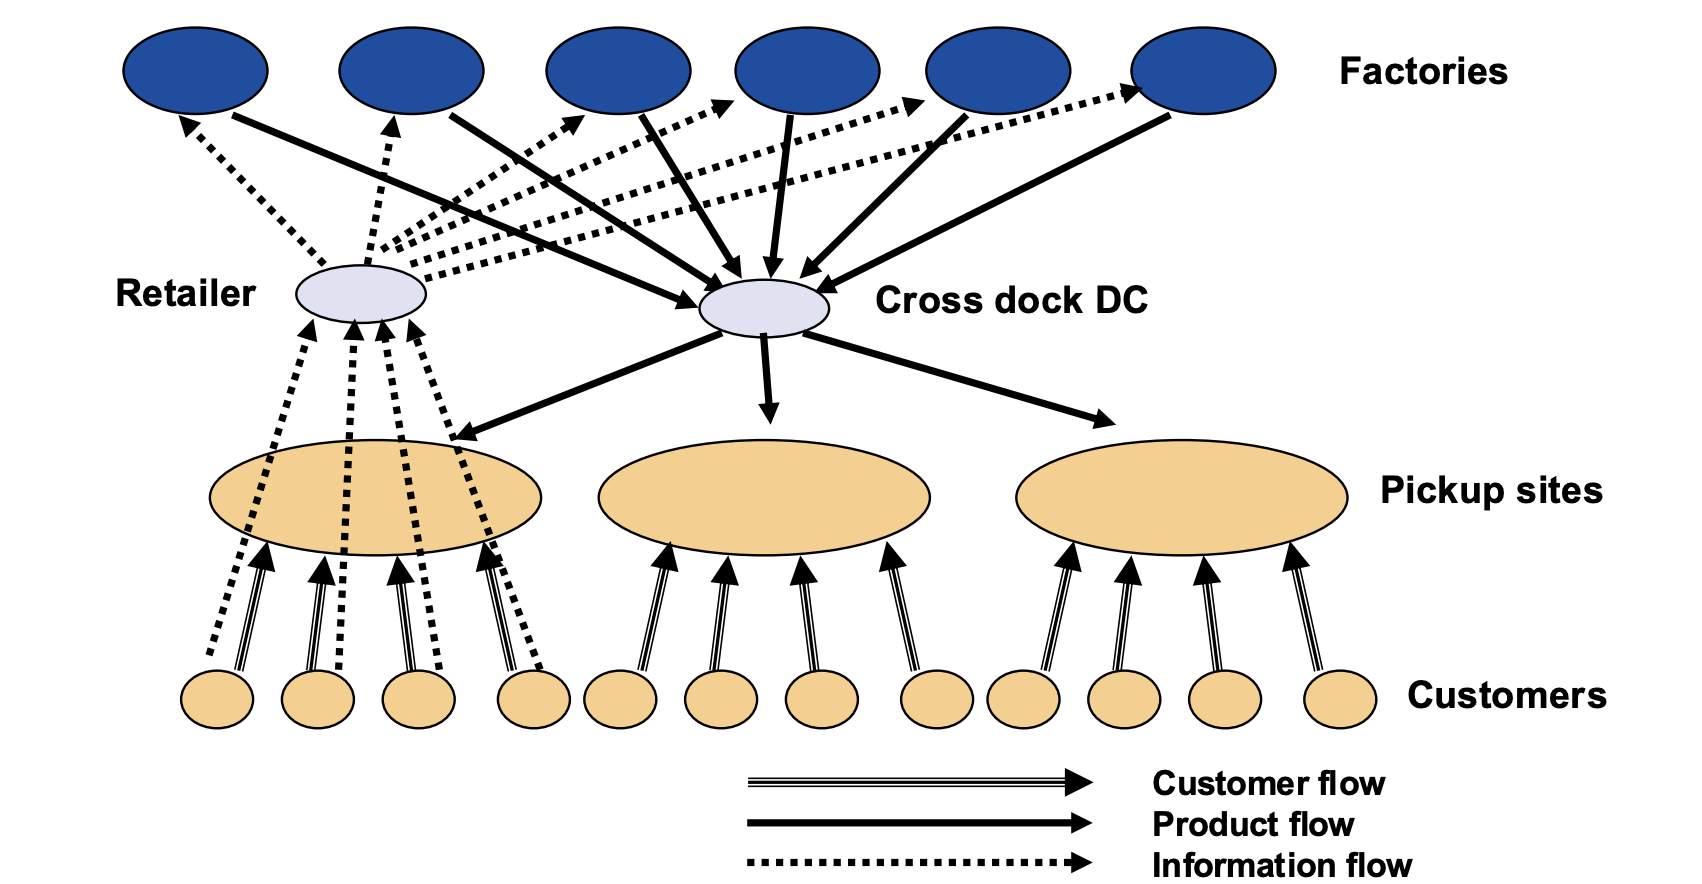
- Inventory is stored at the manufacturer/distrinbutor but the customer places the order and collects the product
Performance Characteristics
- facility cost are higher if new facilities have to be build close to customers
- trasporation costs are reduced due to an unique destination
6. Retail storage with customer pickup
- invetory is stored locally at retail stores
- customers walk in, buy and collect the products
Performance Characteristics
- higher facilities and inventory costs than all the other options
- lower transportation cost
- very quick response time
- customer experience related to wheter shopping is appreciated or not and by the product type
Example: IKEA
IKEA uses its retail stores as "customer pickup points", without the need of having extra facilities or buildings and designing a dedicate fast track line for online orders, without the need of the customer of facing the mess inside the physical store.
Summary: the value of distributors in the supply chain
Distributors can contribute to:
- one-stop shopping, by aggregating products from several manufacturer
- reduction of outbound transportation cost
- reduction of inventory cost
- more stable order stream and lower cost by planning production
- better response time
Impact of online shopping on customer service
- no delay for information
- easier to offer larger variety of products
- more flexible pricing
- faster time to market
- higher customization and convenience in the customer experience
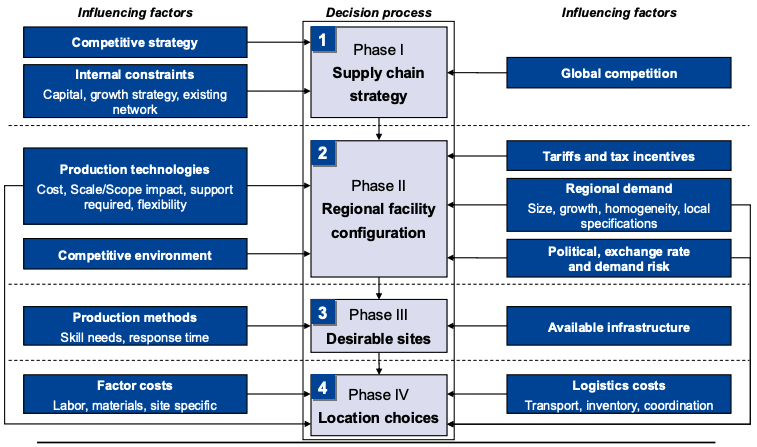
Factors influencing supply chain network design
- When considering technological factors, there are:
- cost-related characteristics (economies of scale, decreasing fixed cost)
- flexibility-related characteristics (flexible manufacturing system, flexible/agile production)
-
Regarding facility roles, they can be classified in the following way (in industrial upgrading order - at the botton the most "upgraded" ones):
-
offshore facility: low cost facility for export production
-
source facility: low-cost facility for global production
-
server facility: regional production facility
-
contributor facility: regional production facility with development skills
-
outpost facility: regional production facility bult to gain local skills
-
lead facility: facility that leads R&D
Novartis HQ in Basel acts as a lead facility: they don't just manufacture, they do most of the R&D work. Once then the process is perfectly designed, they export all the knoweldge in the other facilities.
In a more general and practical way, upgrading a facility can also mean moving from offshore to contributor, by adding a local R&D unit.
5. Basic Supply Chain Network Design and Optimization
Many optimizatio problems can be represented by a graphical network:
- Node (vertex): junction pooint of a network (can represent a location, warehouse, terminal etc...)
- Arc (edge, link): channel throgh which flow may occur (can represent a road, rail track, trade lane etc...)
- Flow (weight): objects passing throgh nodes and arches _(can represente freight, cargo, vehicles etc..., measured in quantity)
- the maximum quantity of flow through an arch: capacity
We can define different types of nodes in a network:
- Source: all flow comes from this node (origin, no predecessor)
- Sink: all flow ends in this node (end, no successors)
- Supply: outflow - inflow > 0
- Demand: outflow - inflow < 0
- Transshipment: outflow - inflow = 0 (conservation of flow)
Point-to-point VS Hubs-and-Spoke networks
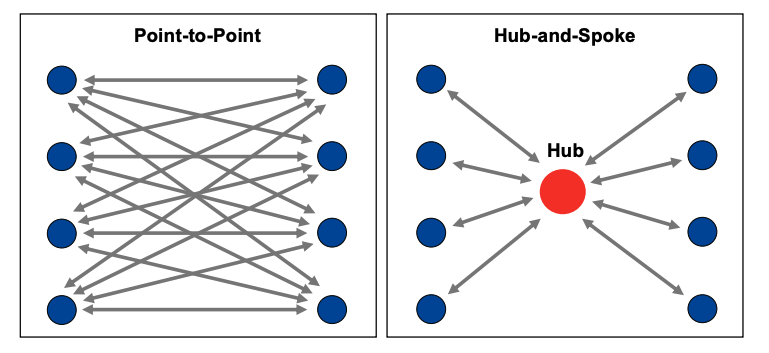
| Point-to-Point | Hub-and-Spoke |
|---|---|
| Traffic in more routes | Traffic in less routes |
| Potentially some low frequency routes | High frequency and high traffic routes, enhancing efficiency |
| Air carriers have applied the Hub-and-Spoke system |
Basic models for supply chain network design/Optimization
Minimum Cost Flow Optimization ProblemsExcel file with a case study optimizaion problem using the built-in Solver .
Assumptions and properties:
- at least one node is a supply node, at least one node is a demand node
- flow only possible in one direction (the arrow)
- each source has a fixed supply, each demand has a fixed demand
- the cost of the flow is proportional to the amount of that flow
The goal is to minimize the objective function (the total cost of all flow). The solution is feasible if and only if the sum of the supplies equals the sum of the demands .
with the following constraints:
- (supply)
- (demand)
- (supply equals demand)
denotes the cost of shipping from to and is the decision variable (the quantity shipped from to ),
For transporation costs, the optimization rewrites as following. We assume supplier warehouse, customer regions, the the objective function is:
- for each origin (all supply must be distributed)
- for each destination (all demand must be distributed)
Some special case modifications to the transportation problem:
- Maximum shipping capacity from to :
- Minimum shipping guarantee from to :
- if supply > demand: add a dummy destination with zero cost and its demand equals to the remaining supply
- if a rouce it not accessible: remove the corresponding decision variable
Assignment problems
Given a set of agents, a set of tasks and a cost table, the goal is to match agents to tasks so that all tasks are performed at the minimum possible ost.
Note that an assignment problem is a special case of a minimum-cost flow problem in which all suppliers and all demands are equal to 1.
Some initial assumptions needed:
- the numbers of agents and tasks are the same ()
- each agent is assigned to exactly one task and each task is performed by exactly one agent
- all agents are assigned and all tasks are performed
- for each task (each task is done by 1 agent)
- for each agent (each agent is assigned at 1 task)
- integer
Special case mofifications to the assignment problem:
- Number of agents exceeds the number of tasks:
- An agent can work one multiple tasks ( tasks):
- Number of tasks exceeds the number of agents: add enough dummy agents
- An assignment is unacceptable: remove the corresponding decision variable
Transshipment Problems
It is a special case of a transporation problem where the freight moves through intermediate nodes before reaching the final destination.
- for all supply nodes
- for all transshipment nodes
- for all demand nodes
in a more general version, constraints can be written as:
The first sum represents the outflow, the second the inflow and the third on the right the net flow. represents the arc capacity
Maximum Flow ProblemsThe goal is to maximise the amount flowing through the network rather than minimizing the cot of the flow. In maximum flow problems, the source and the sink do not have fixed supplies and demands.
Some initial assumptions:
- all flow starts at one node (source ) and terminates at one other node (sink )
- all other nodes are transshipment nodes
- flow is only allowed in one direction
such that
Shortest path problemsThe goal is to find the shortest path (with the minimum total length) from the origin () to the destination .
such that
6. Advanced Supply CHain Network Design and Optimization
Capacitated Plant Location ModelsIn this model, we assume plants with capacity serving regions with demand , each of them with fixed (), variable () costs is the decision variable indicating wheter plan should be open, denotes the quantity transported from to .
such that
Capacitated Plant Location Models with Single SourcingThe main different from the previous model is that now each region can be served only by one plant (but a plant can serve multiple regions). The optimization problem rewrites as follows:
such that
Gravity Location ModelFirst of all, in order to calculate distances, we need to transform geographical coordinates latitude, longitude and height, to cartesian cordinates . Then:
- the gravity location model assumes the customer are located as grid points on a planned
- every grid point point is a potential plant location/solution
- we look for the spot that represents the gravity of all customers.
Given the coordinates of each customer: , :
- we compute the distance from the center:
- we set the quantity to be shipped at each customer
- we compute to each customer and the minimze the total cost:
Note that, since the objective function is not linear, there is no analytical solution for the problem, but only a iterative algorithm.
Minimum Spannin Tree ProblemsThe goal is to minimize the total lenght of links inserted in a network.
Starting with only the nodes for a network, the problem now is to design the network by deciding which links to add.
Prim's algorithm:
- Start with any node (often the one with the cheapest edge)
- Grow the tree by repeatetly adding the cheapest edge connecting another node outside the tree
- repeat until all nodes are included
- break ties arbitrarly
7. Inventory Management
Inventory is the set of items that an organization holds for later use by the organization
The main functions of inventory:
- permit operations and meet anticipated demand
- smoothen production requirements
- take advantage of quantity discounts
- reduction of control cost (inventory cost vs permanent monitoring cost)
- decouple operations (buffers)
- protect against stocks out (delayed delivers)
Primary goal of inventory management is to urchase product in lot sizes that minimize the sum of material, ordering and holding cost.
Just-in-Time Inventory Management (JIT)
The core idea is tu supply materials exactly when needed, minimizing inventory and waste.
- reduce inventory
- eliminate waste
- streamline product flow
- strengthen supplier coordination
with associated benefits:
- lower holding costs
- faster response to demand changes
- improved quality and efficiency
- smaller storage needed and risks:
- disruption vulnerability
- efforts in supplier management
- limited buffer stock
The Economic Order Quantity (EOQ) Model
Cycle inventory: the average inventory that builds up in the supply chain because a stage produces or purchases in lots.
given the quantity/dimension of each lot and assuming that demand is stable, replenishment is costant and indipendent of demand.
Lower cycle inventory is better because:
- average flow time is lower
- working capital requirements are lower
- lower inventory holding costs
we then define:
- as the average price paid per unic purchased
- as a fixed ordering/setup cost occurring eath time an order is placed.
- as the holding cost in the inventory (including cost of capital, physical warehouse, products becoming obsolete etc...) (sometimes as a fractoin of the unit cost of product)
we then assume the followings:
- production is istantaneous
- delivery is immediate and deterministic (no uncertainty)
- demand is costant over time
- each order implies a costant setup cost
- products can be ordered and analyzed individually
Given , , , , we want to find (lot size) and sn$ (order frequency / time between orders) that minimize the total annual cost.
- annual material cost
- number of orders per year
- annual ordering cost
- annual holding cost
then the total annual cost is
to minimize TC, we take the first derivative with respect to and we set it equal to :
Rearraging we find the optimal lot size, also defined as the economic order quantity:
the order frequency is then computed as:
and the cycle time in years when demand is in years (how much time between orders) as:
To sum up, the EOQ model:
- easy to compute
- does not require data hard to obain
- policies are ronust
- assumptions can be relaxed
- it gives a good overall idea and can be the starting point for more complicated models
Economic Production Quantity (EPQ)
It is an extension of the EOQ that takes into account that the inventory arrives in increments at (production rate).
Therefore the inventory builds up at rate when production is on and depleted at rate when production is off.
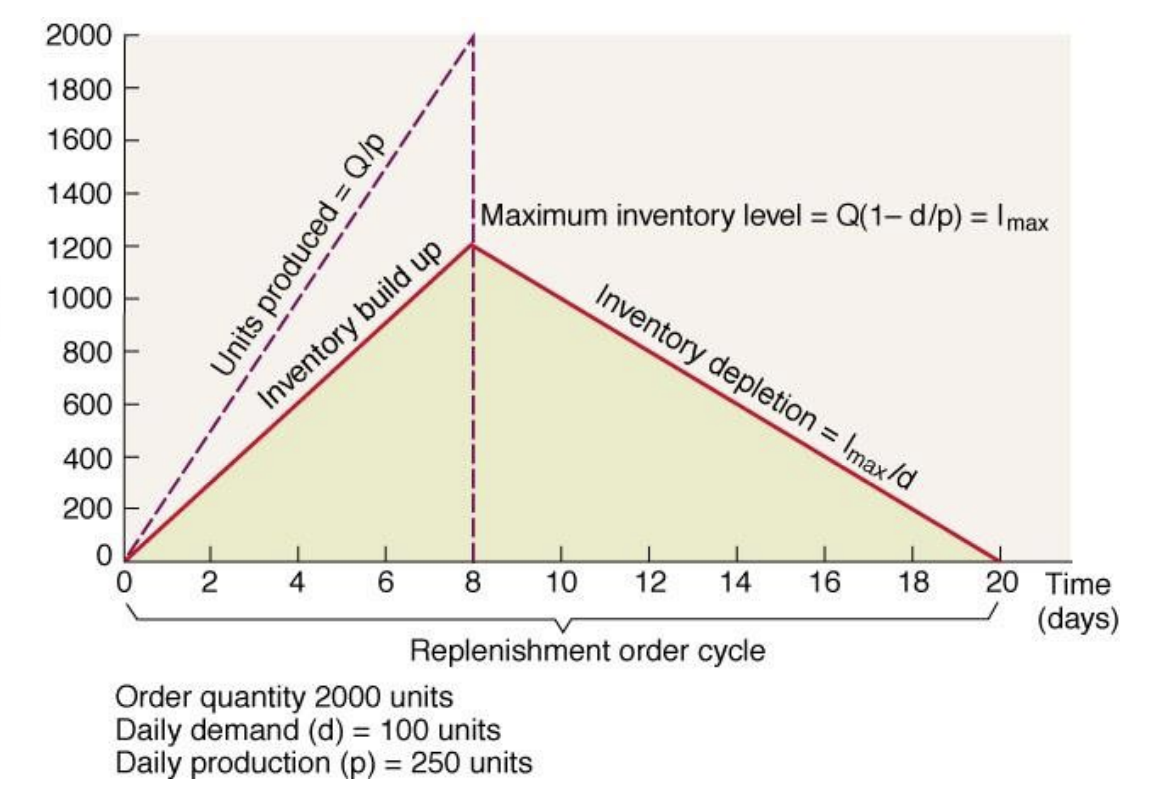
In this case, the total cost is adjusted and given by:
where is the maximum inventory and it is given by
Following the same derivation of the EOQ, we obtain the following optimal lot size:
The Newsvendor Model
The classical newsvendor problem occurs when:
- short selling period
- only one procurement/order opportunity _(every specific day for the newsvendor)_a
- stochastic/random demand
- products loose value after the period leading to lost sales, leftovers and no value for any remaining unsold product.
We then define the associated costs:
- : holding (overage) cost per unit remaining at the end of the period
- : shortage (underage cost) per unit at the end of the season
The decision variable is : the order quantity to maximize profit
To obtain the optimal , the following methods are possible:
- Brute force enumeration: Calculate for all possible
- Compute
- Incremental Analysis
Incremental analysis focuses on the cost/benefit of ordering one additional unit
- if the extra unit is sold, you make additiona in profits.
This event happens with , therefore the expected benefit is:
- if the extra unit is not used, you wasted .
This event happens with , therefore the expected loss is:
At the optimal , benefits and loss should balance each other:
Collecting the terms, we obtain the optimal condition (also known as the Critical Ratio):
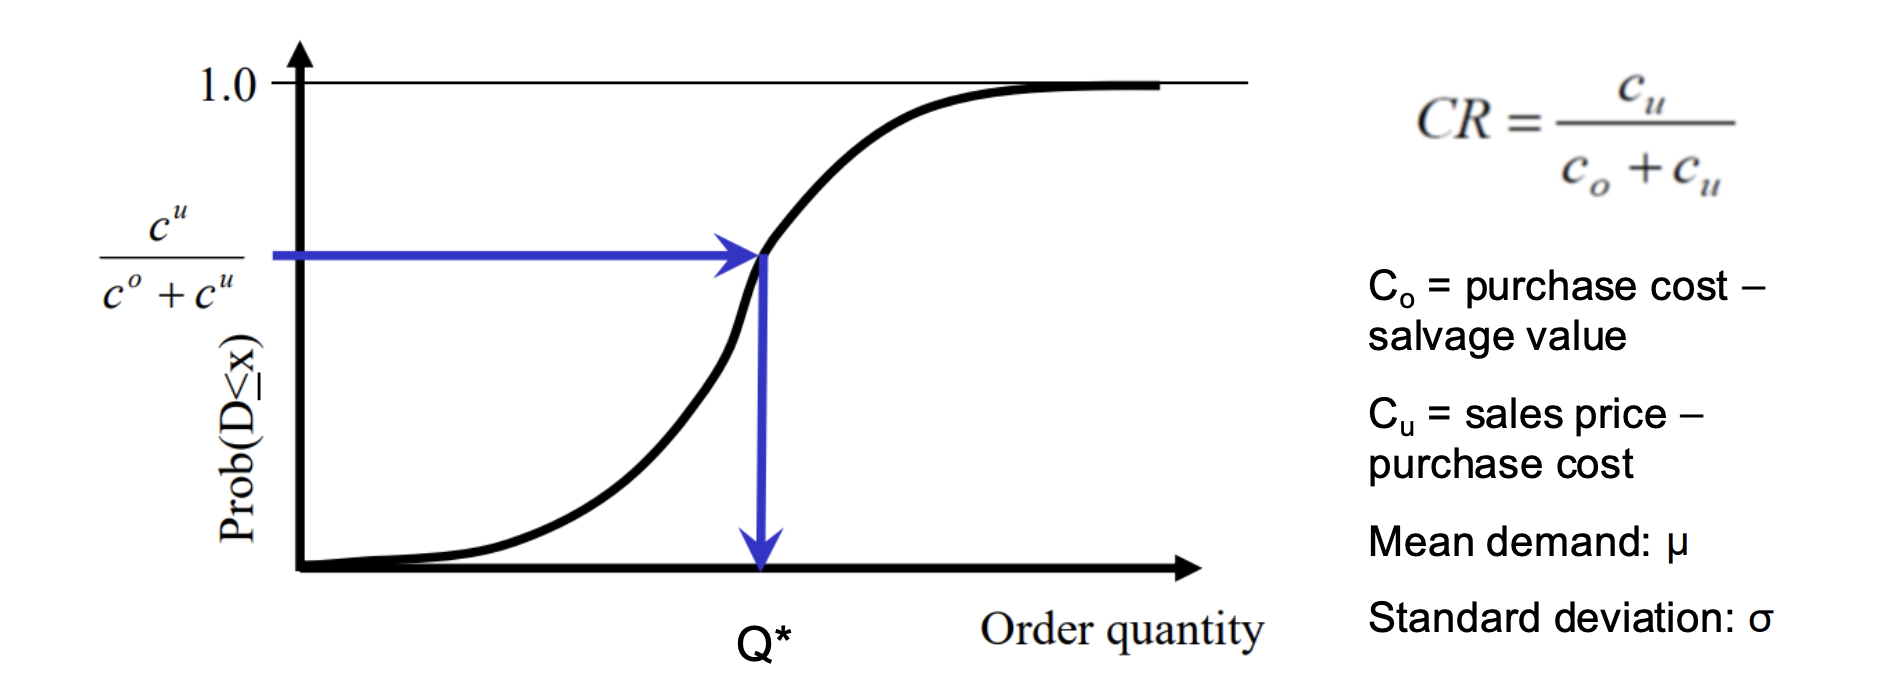
For normally distributed demands, is computed using the corresponding z-value:
To sum up, below a quick comparison between the EOQ and the Newsvendor Model:
| EOQ | Newsvendor Model |
|---|---|
| Uniform and deterministic demand | Variable and stochastic demand |
| Stable demand with infinite time horizon | Single period approach |
| Reusable inventory | Any leftovers are useless. Insatisfied demand is a loss |
| Minimize cost | Maximize profit |
8. Coordination in the Supply Chain
Supply chain coordination means working together with the aim of improving performance, aligning plans and objectives.
To do that, each stage should take into account the effects of its actions on other stages.
Lack of coordination reduces total supply chain profits with different consequences in the "world": a famous example is the bullwhip effect (BWE).
The bullwhip effect happens when small changes in consumer demand get amplified into larger swings in orders and inventory as you move upstream close to the manufacturer.
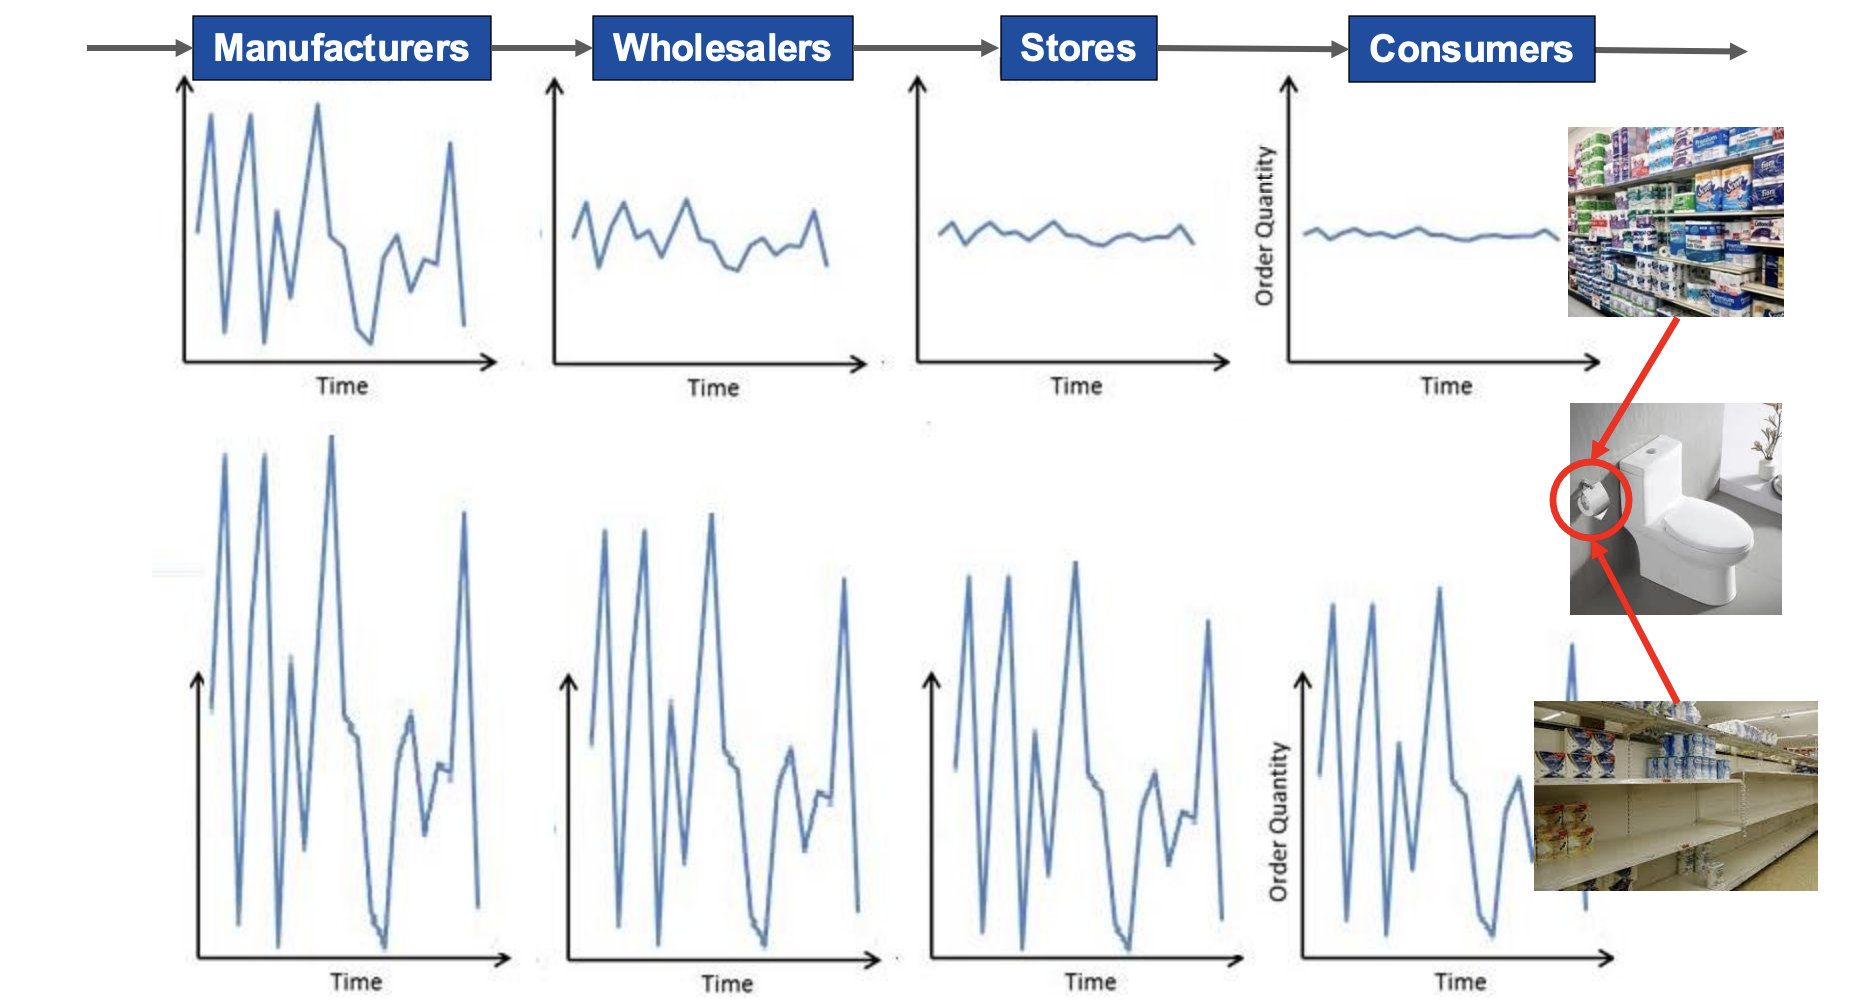
- shortage/gamig and panic buying are classic cause of bullwhip effect
- stores impose limits on the maximum quantity people can purchase to address this
Different reasons behind the bullwhip effect:
- companies place periodic orders
- the demand forecast is based on orders received (often by retailers or intermediaries), not on the end user real demand
- the supply is allocated as a % of the amount ordered
- promotional pricing causes distortions in demand
This has negative effects on the whole supply chain:
- increased manufacturing cost
- increased inventory cost
- increased replenishment lead time
- increased transporation cost
- increased labor cost for shipping and delivering
- decreased availability of products
- worse relationship across the supply chain
resulting in a whole supply chain that moves away from the efficient fronties due to higher costs and lower responsiveness.
Example: the Bullwhip effect in post-pandemic retailDuring covid, demand for Peloton products exploded, the company received a lot of orders and therefore ordered massive amounts of inventory. When then demand stabilized, they were left with inventoru excess.
This is classic information driver failure: the lack of real time data and the delay of orders led to an excess of stock.
In this cases, Vendor Managed Inventory or collaborative planning and forecasting to share real time data with suppliers can reduce bullwhip effects.
Peloton's rise and fall during COVID [CNBC]-
Vendor Managed Inventory [WIKIPEDIA]Measuring information distortion
| Order Variance Amplification | Schedule Instability Amplification |
|---|---|
| Levelness | Stability |
| In a perfectly levelled schedule, the actual material required in every week are the same | In a perfectly stable schedule, all the forecast are the same and coincide with production |
| Variation in production between periods is low | Production according to plan |
To compute levelness (or bullwhip effect), we firstly compute:
- the order variance ratio (OVR) at (manufacturer/ wholesaler level)
where is the variance of outcoming orders at over intervals.
- the order variance ratio at (retailer/consumer level):
BEW is said to prevail if:
(the upstream exceeds downstream )
To compute stability we firstly need to:
- define the schedule change at the level (echelon) in consideration at one poin in time:
for each forecast for a particular time period.
- then the overall stabilit/instability across periods is defined as:
Instabilities are sait to increase upstream when
Obstacles to coordination and remedial actions
- Incentive obstacles aligning goals and incentives
- Information and processing obstacles improving information accuracy
- Operational obstacles improving operational performance
- Pricing obstacles designing pricing strategies to stabilize orders
- Behavioral obstacles building strategic partnerships with trust
Supply chain partnerships can be divided in 3 clusters:
- Type : coordinationan on a limited basis, short term focus, involves one functional area of the firm.
- Type : integration and integration of activities, long term focus, multiple divisions and functions involved.
- Type : significant level of integration, each firm views sees the other as a exentension of their own firm, typically no "end-date" approach.
| Type I | Type II | Type III | |
|---|---|---|---|
| Planning style | Ad hoc basis | Regularly | Systematic (both regularly and ad hoc) |
| Planning level | Projects and tasks | Process | Relationship |
| Planning content | Sharing of existing plans | Performed jointly, eliminating conflicts | Performed jointly at multiple levels |
| Operation Measurement | Performance measured developed indipendently, results may be shared | Measures jointly developed, focus is on individual firm performance | Measures are jointly developed and shared |
| Ability to make changes | Firm may suggest changes to the other | Firm may make changes to the other AFTER approval | Firm may make changes to the other WITHOUT approval |